Tom Garncarz

Product Designer

Email me!

EV Charging Site Host Dashboard

ChargeLab

//

May 2022 - present

Product design

Information architecture

B2B

Desktop

User research

Climate

As ChargeLab’s sole product designer (and then as its Head of Design), one of my core responsibilities has been to redesign the company’s core products to give them a best-in-class user experience in the crowded electric vehicle (EV) charging market.

One of these products is the Site Host Dashboard, a B2B product aimed at helping owners of EV charging sites manage, maintain, and profit from their chargers.
Scroll

Key issues

When I joined ChargeLab in 2022, the Site Host Dashboard had three fundamental issues holding the company back from scaling:

1. Prospects didn’t want it

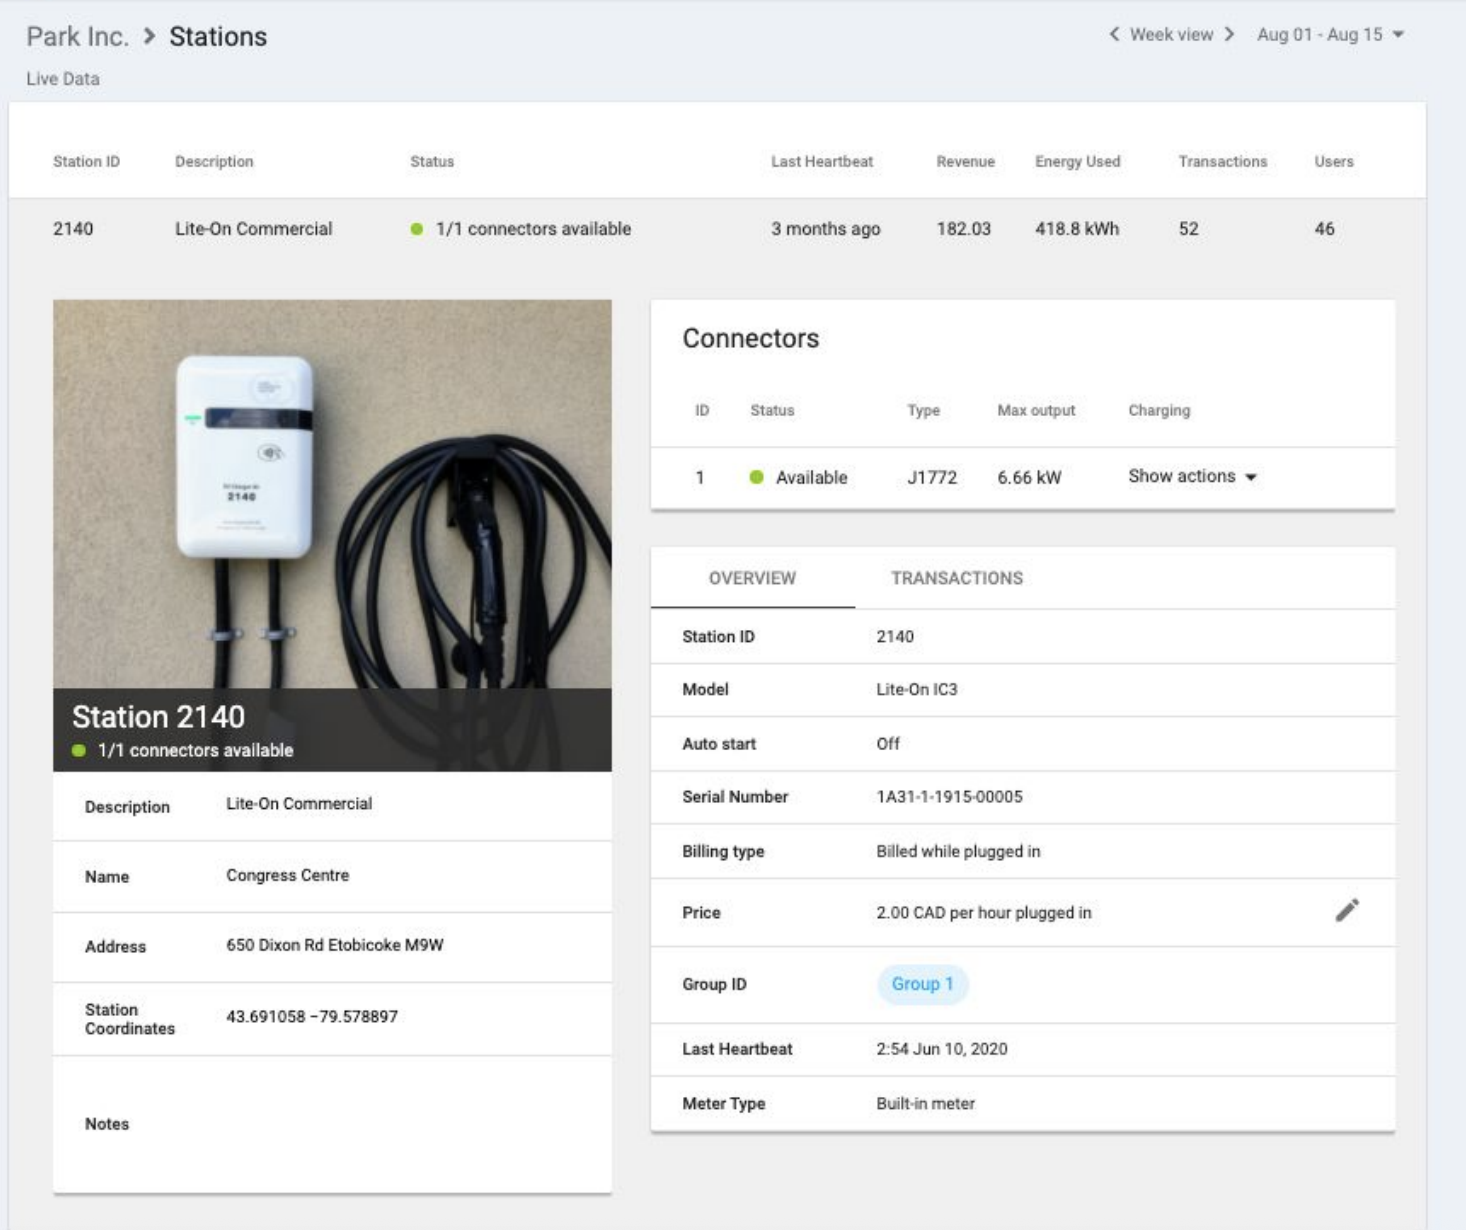
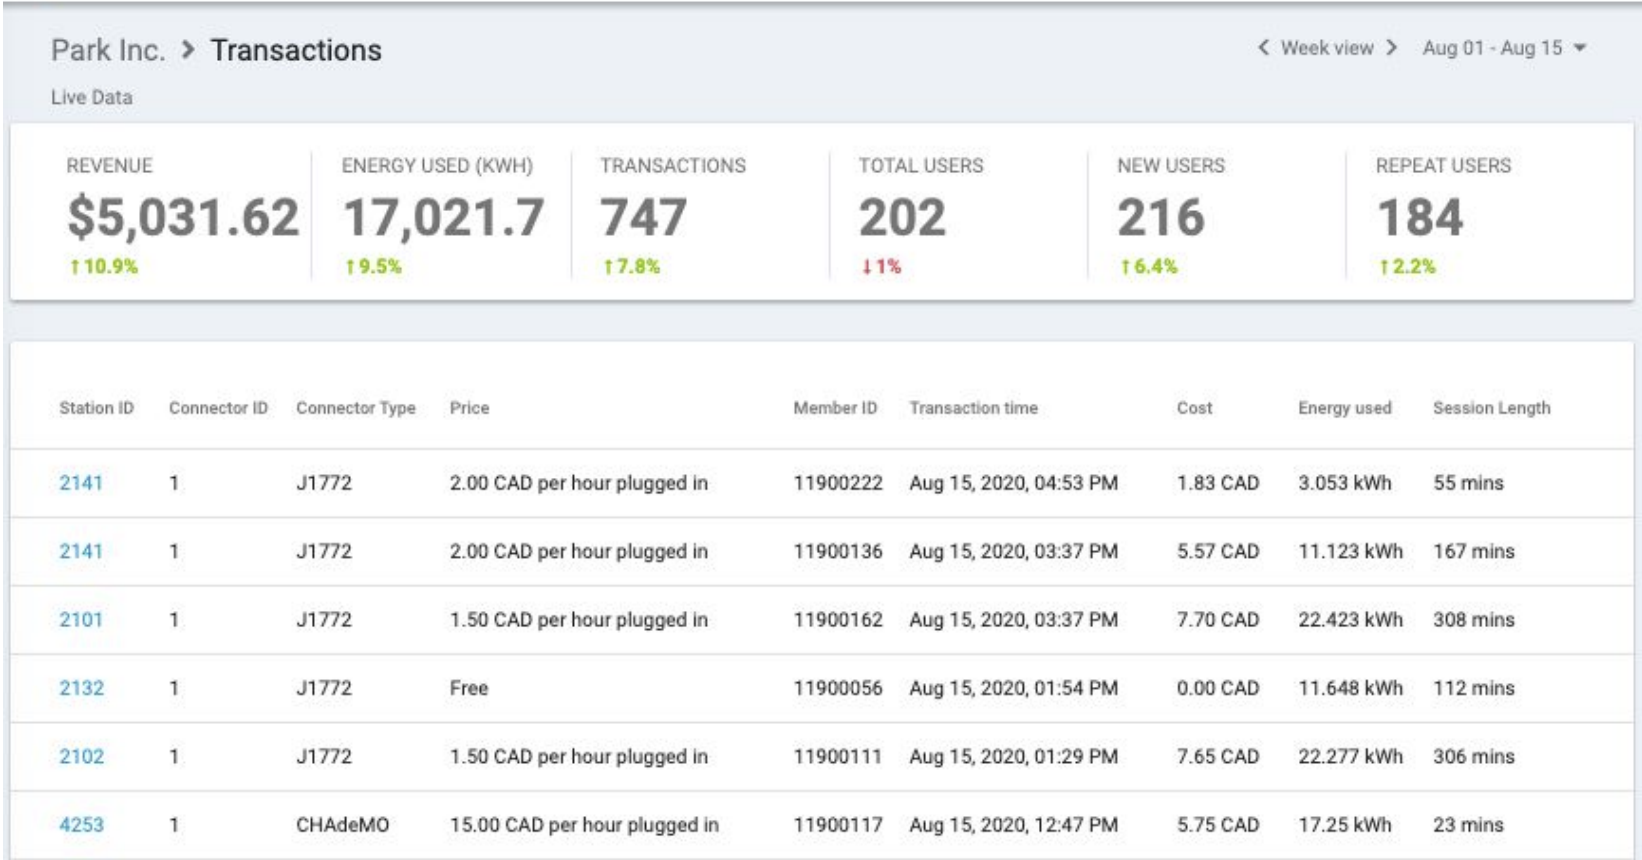
The existing iteration of the Dashboard was not very visually appealing and was stylistically years out of date.


The Sales team didn’t feel comfortable showing it to prospective clients, limiting the company’s ability to meaningfully compete in the market.

2. Existing users weren’t happy

Furthermore, existing users of the Dashboard had to contend with a number of significant bugs and usability issues, causing friction and churn.

3. The team couldn’t build on it

Because the Dashboard’s information architecture was not designed to be scalable, adding new features and responding to evolving user needs was very difficult and time consuming for the Product and Engineering teams.

The initial iteration of the dashboard suffered from a number of significant design issues, and were a significant drag on ChargeLab’s performance.

Changes

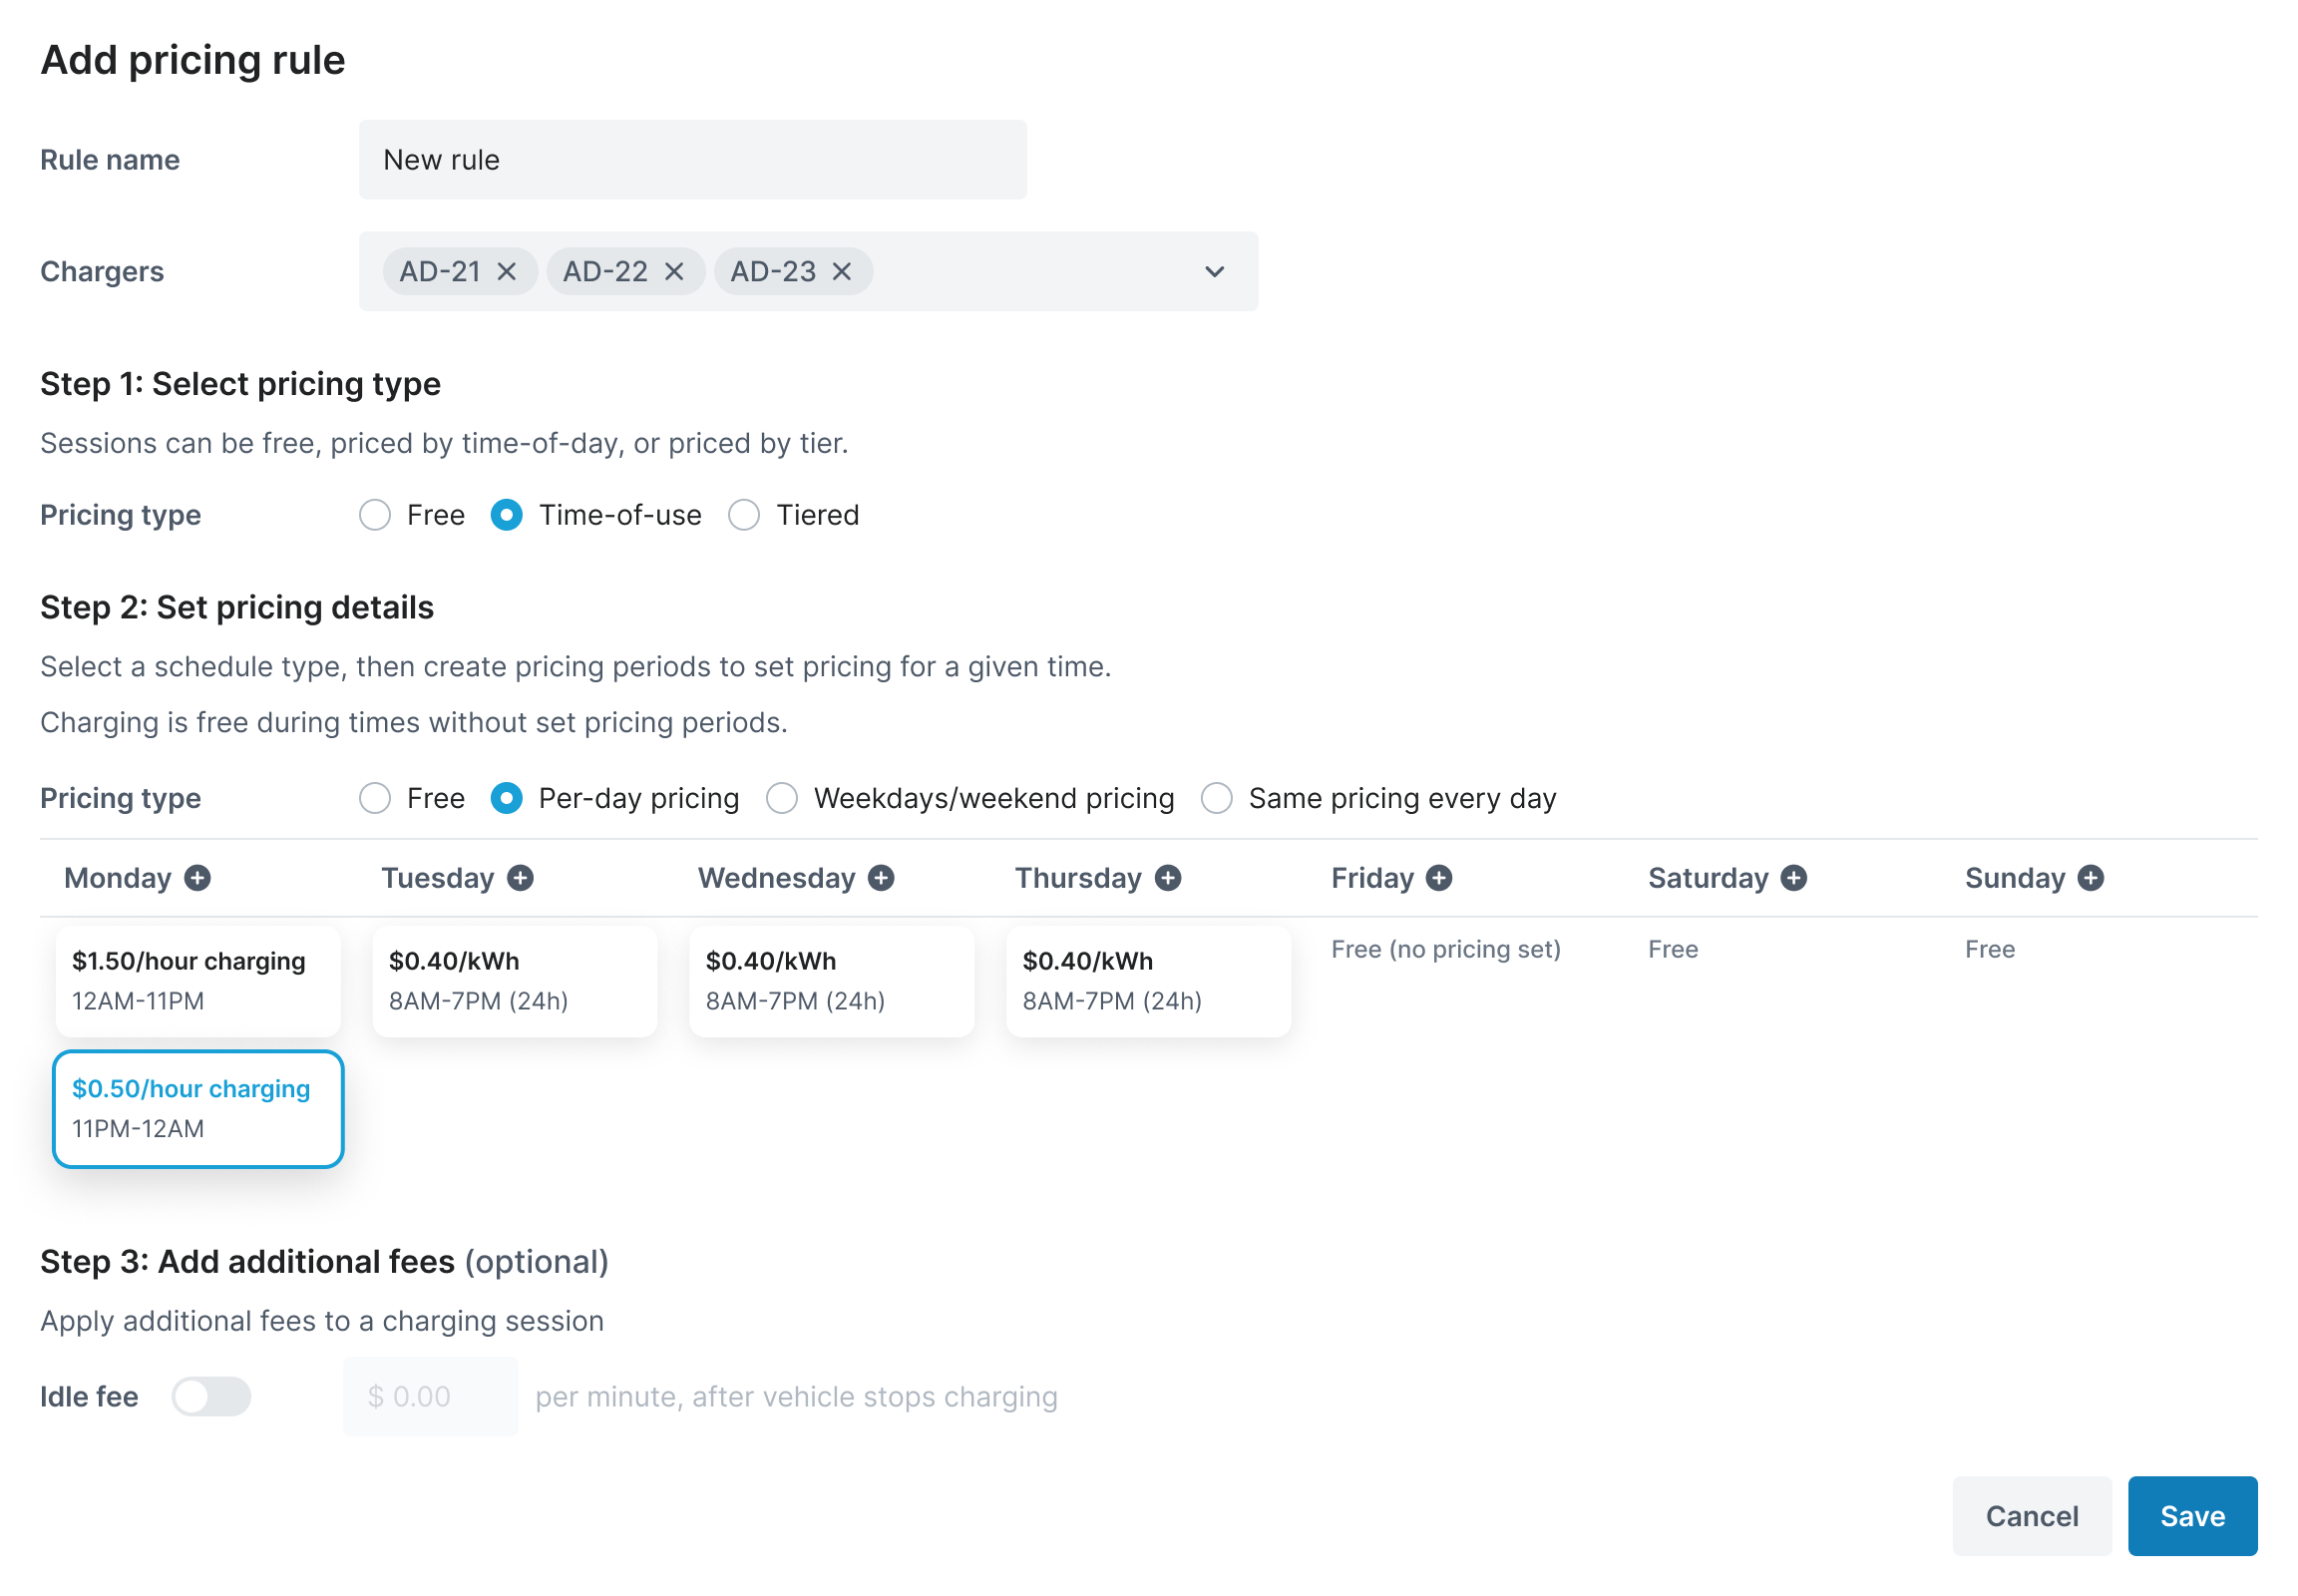
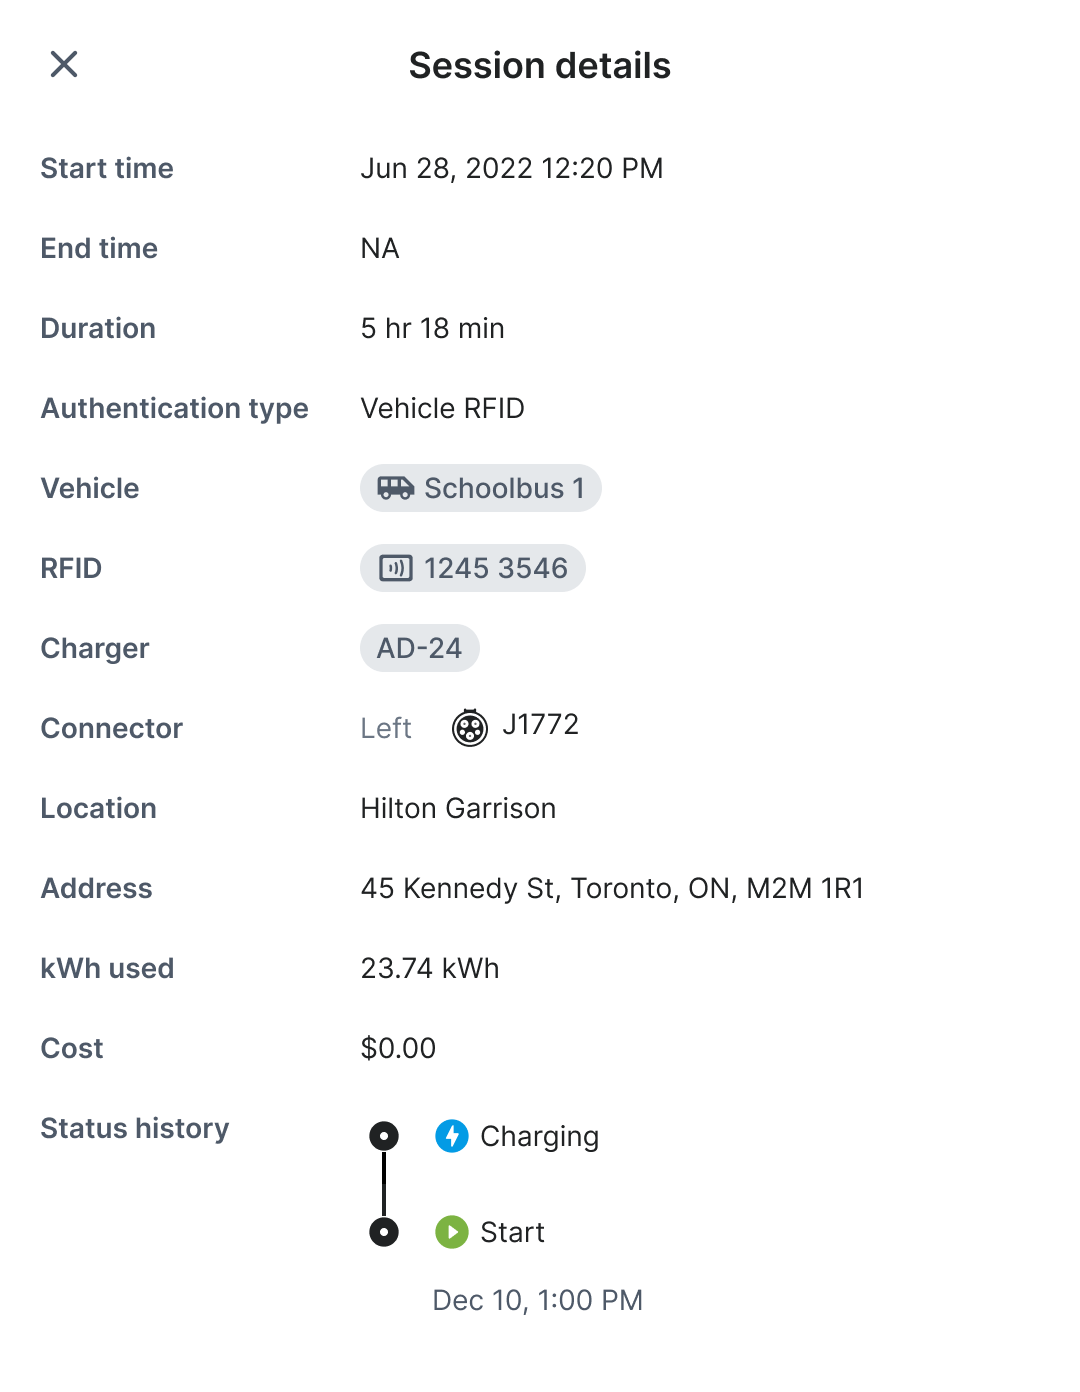
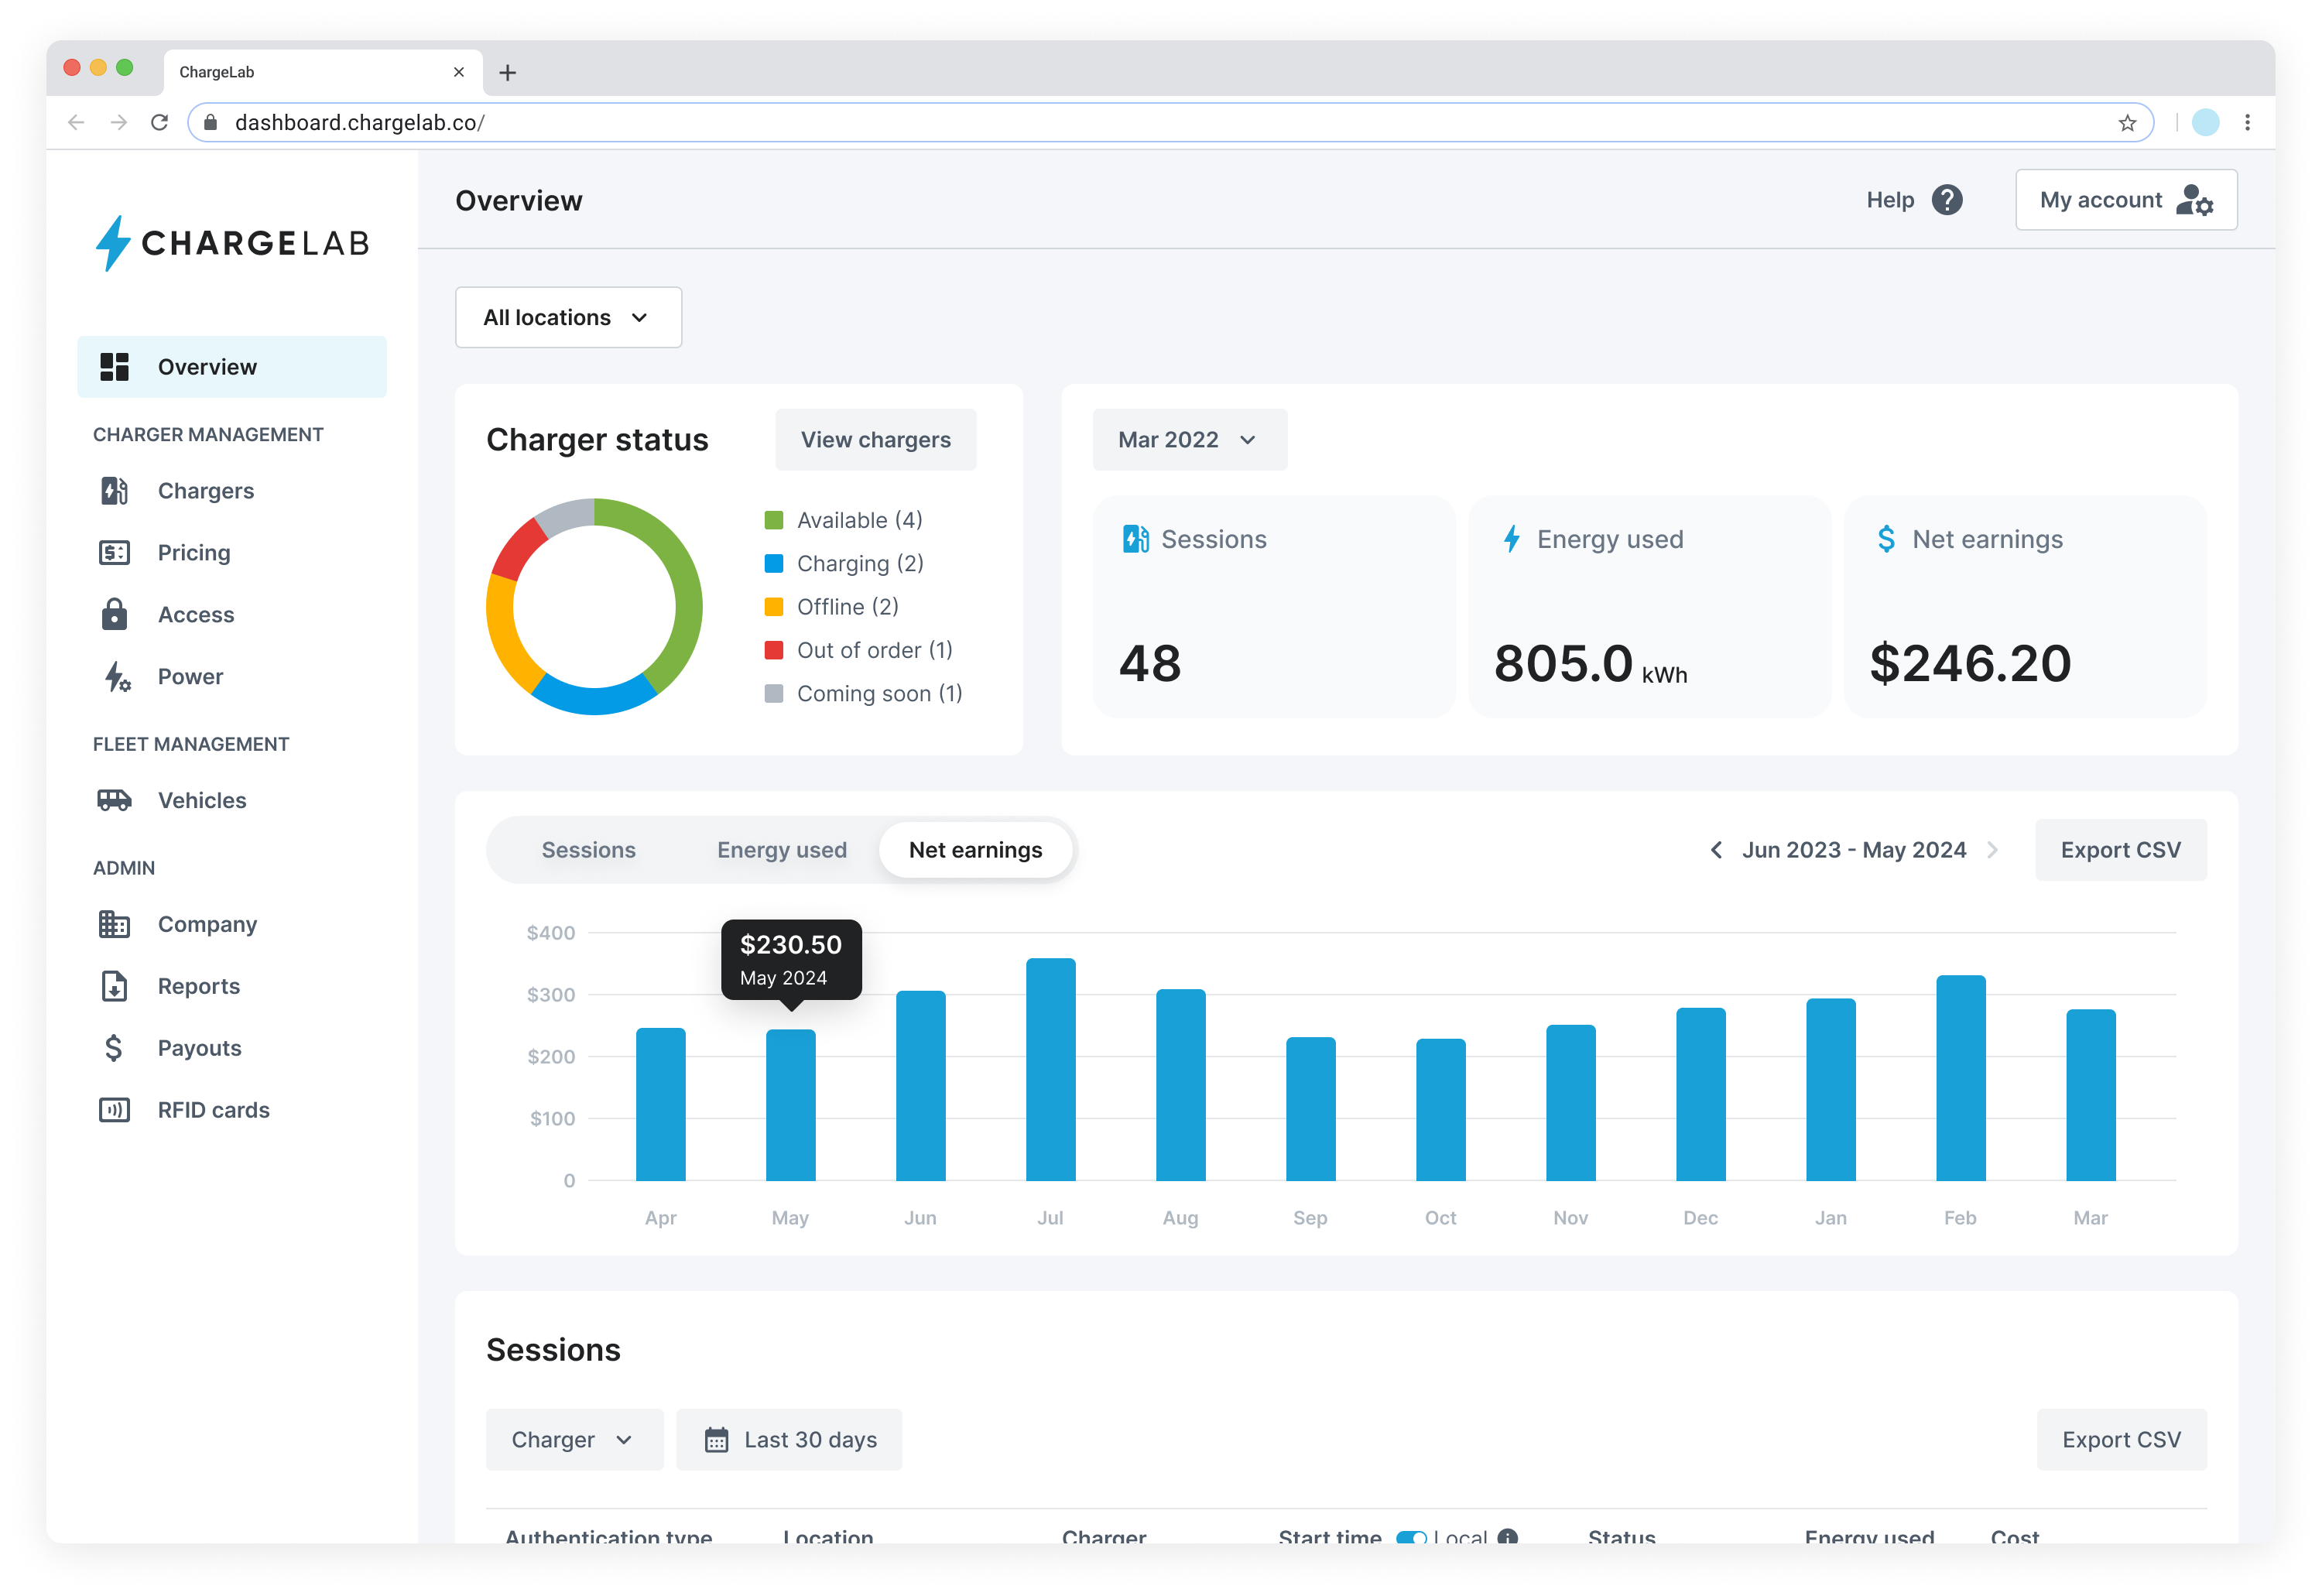
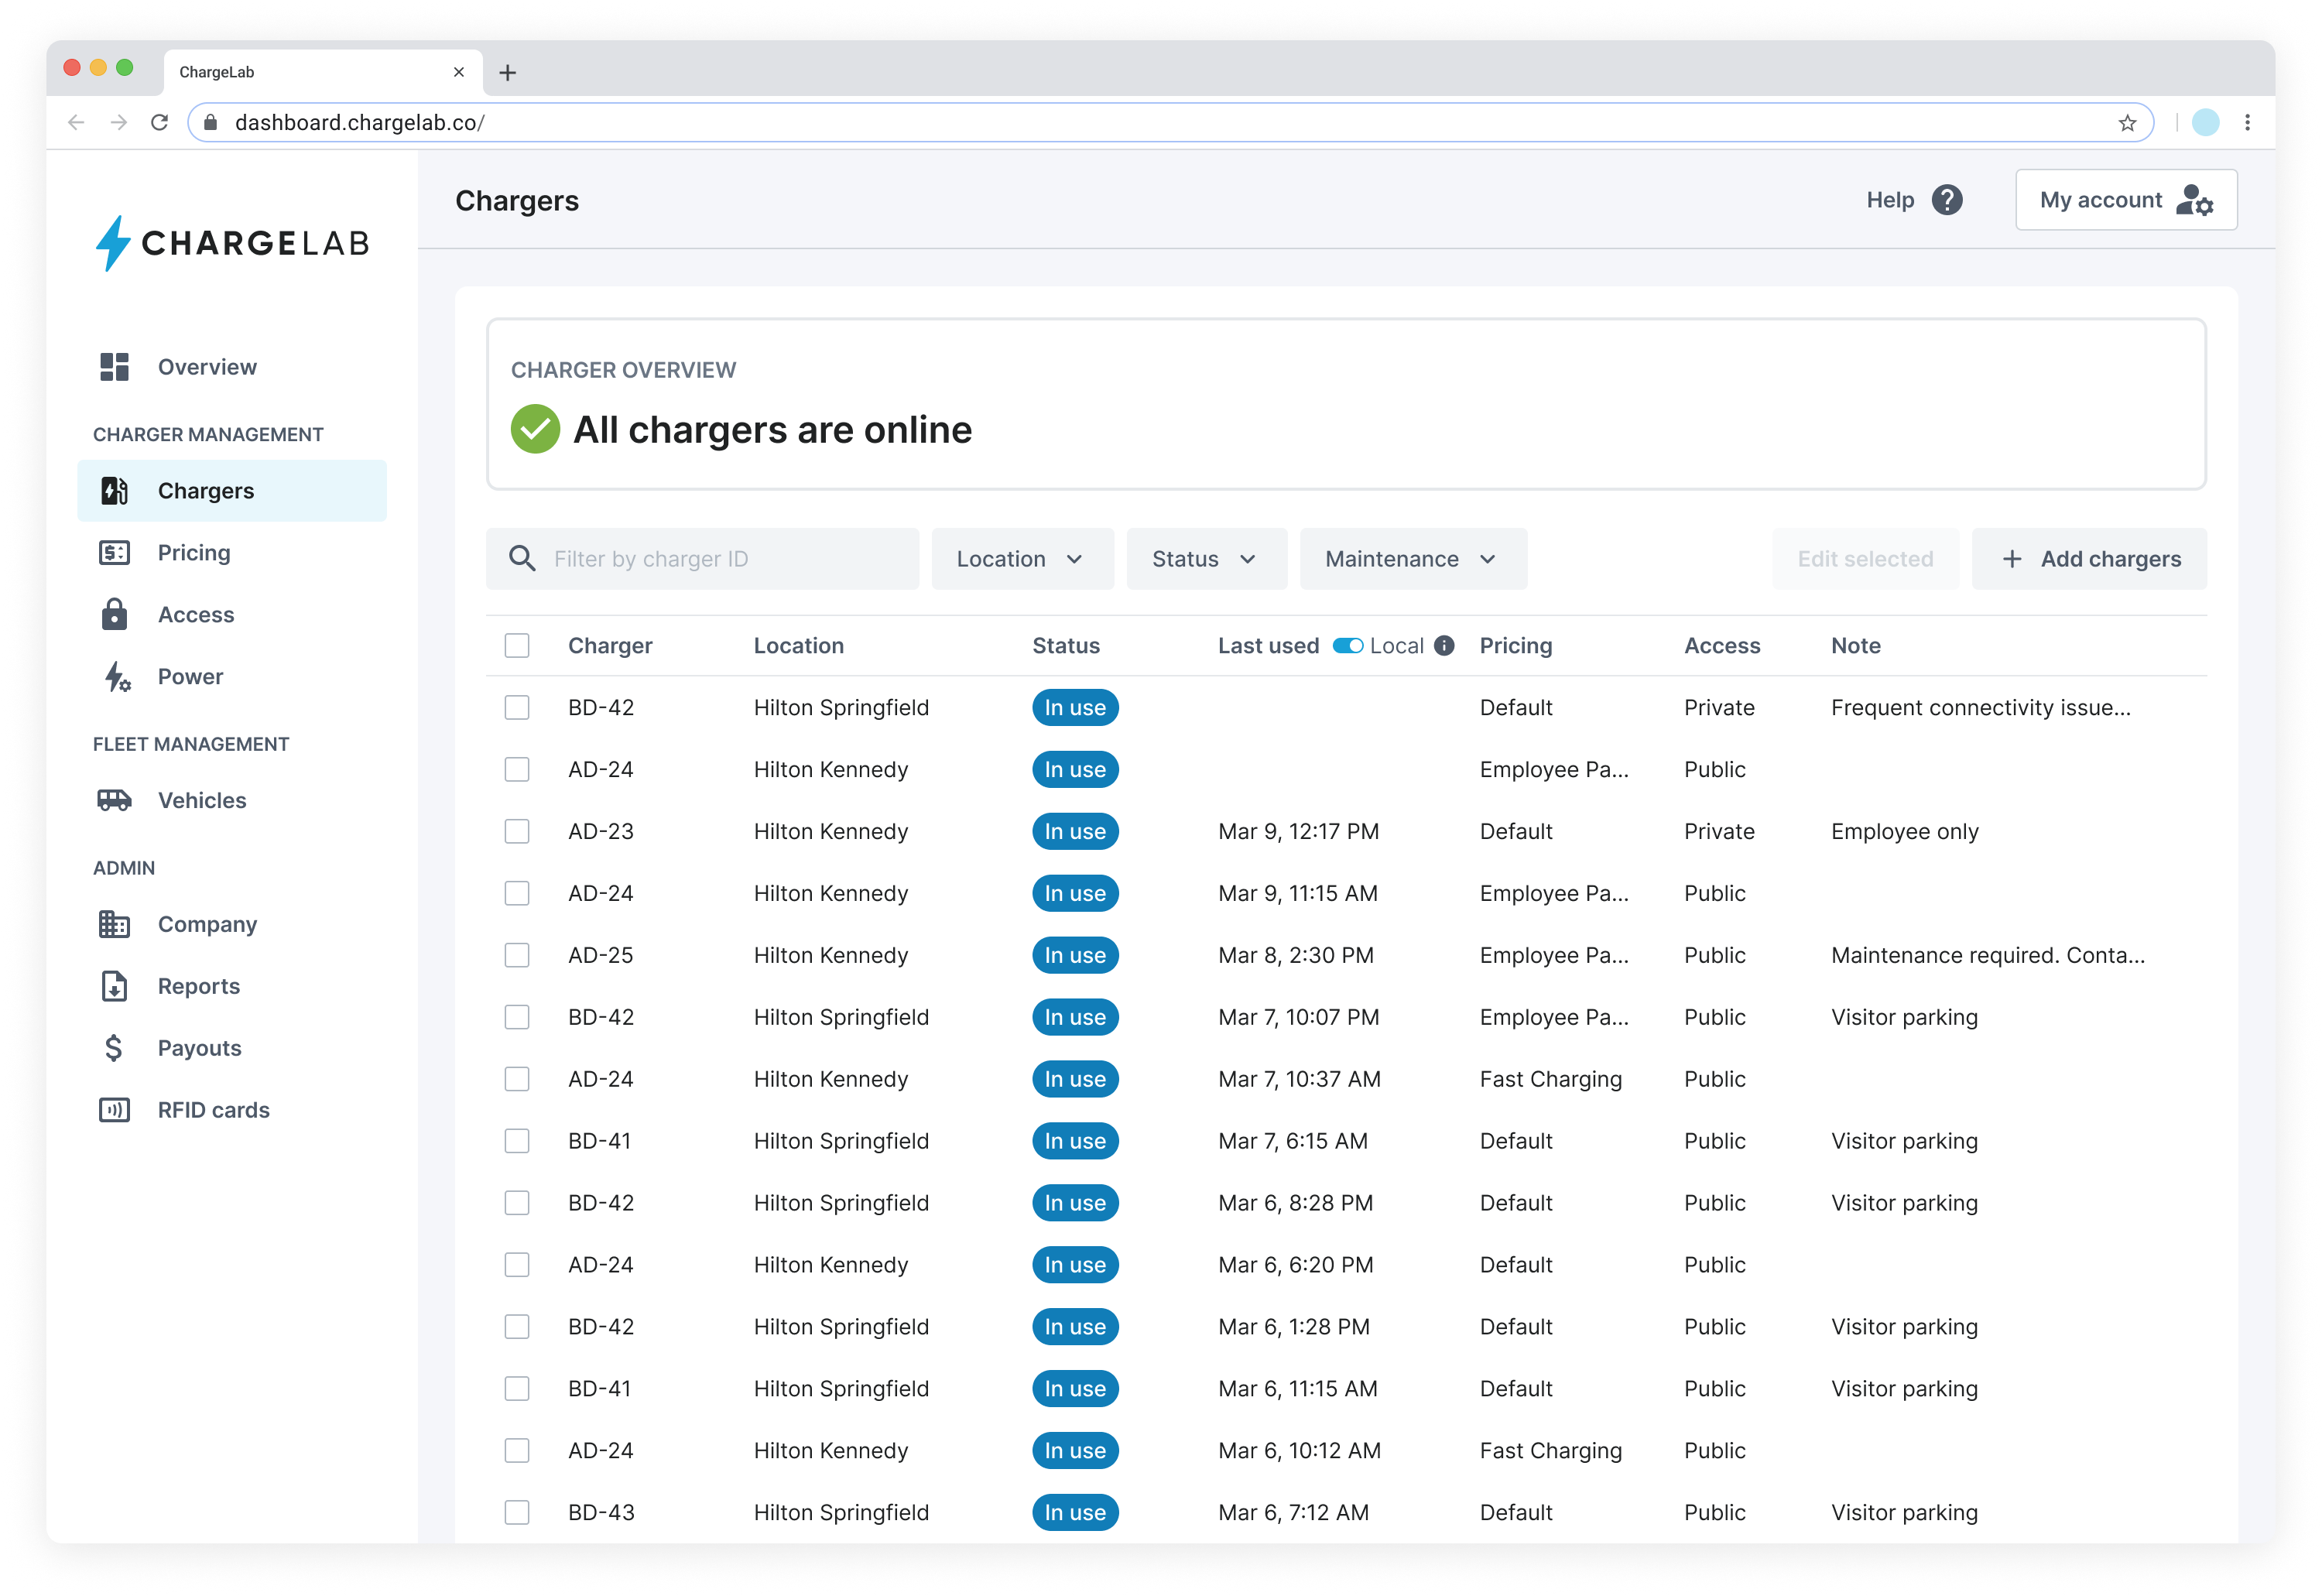
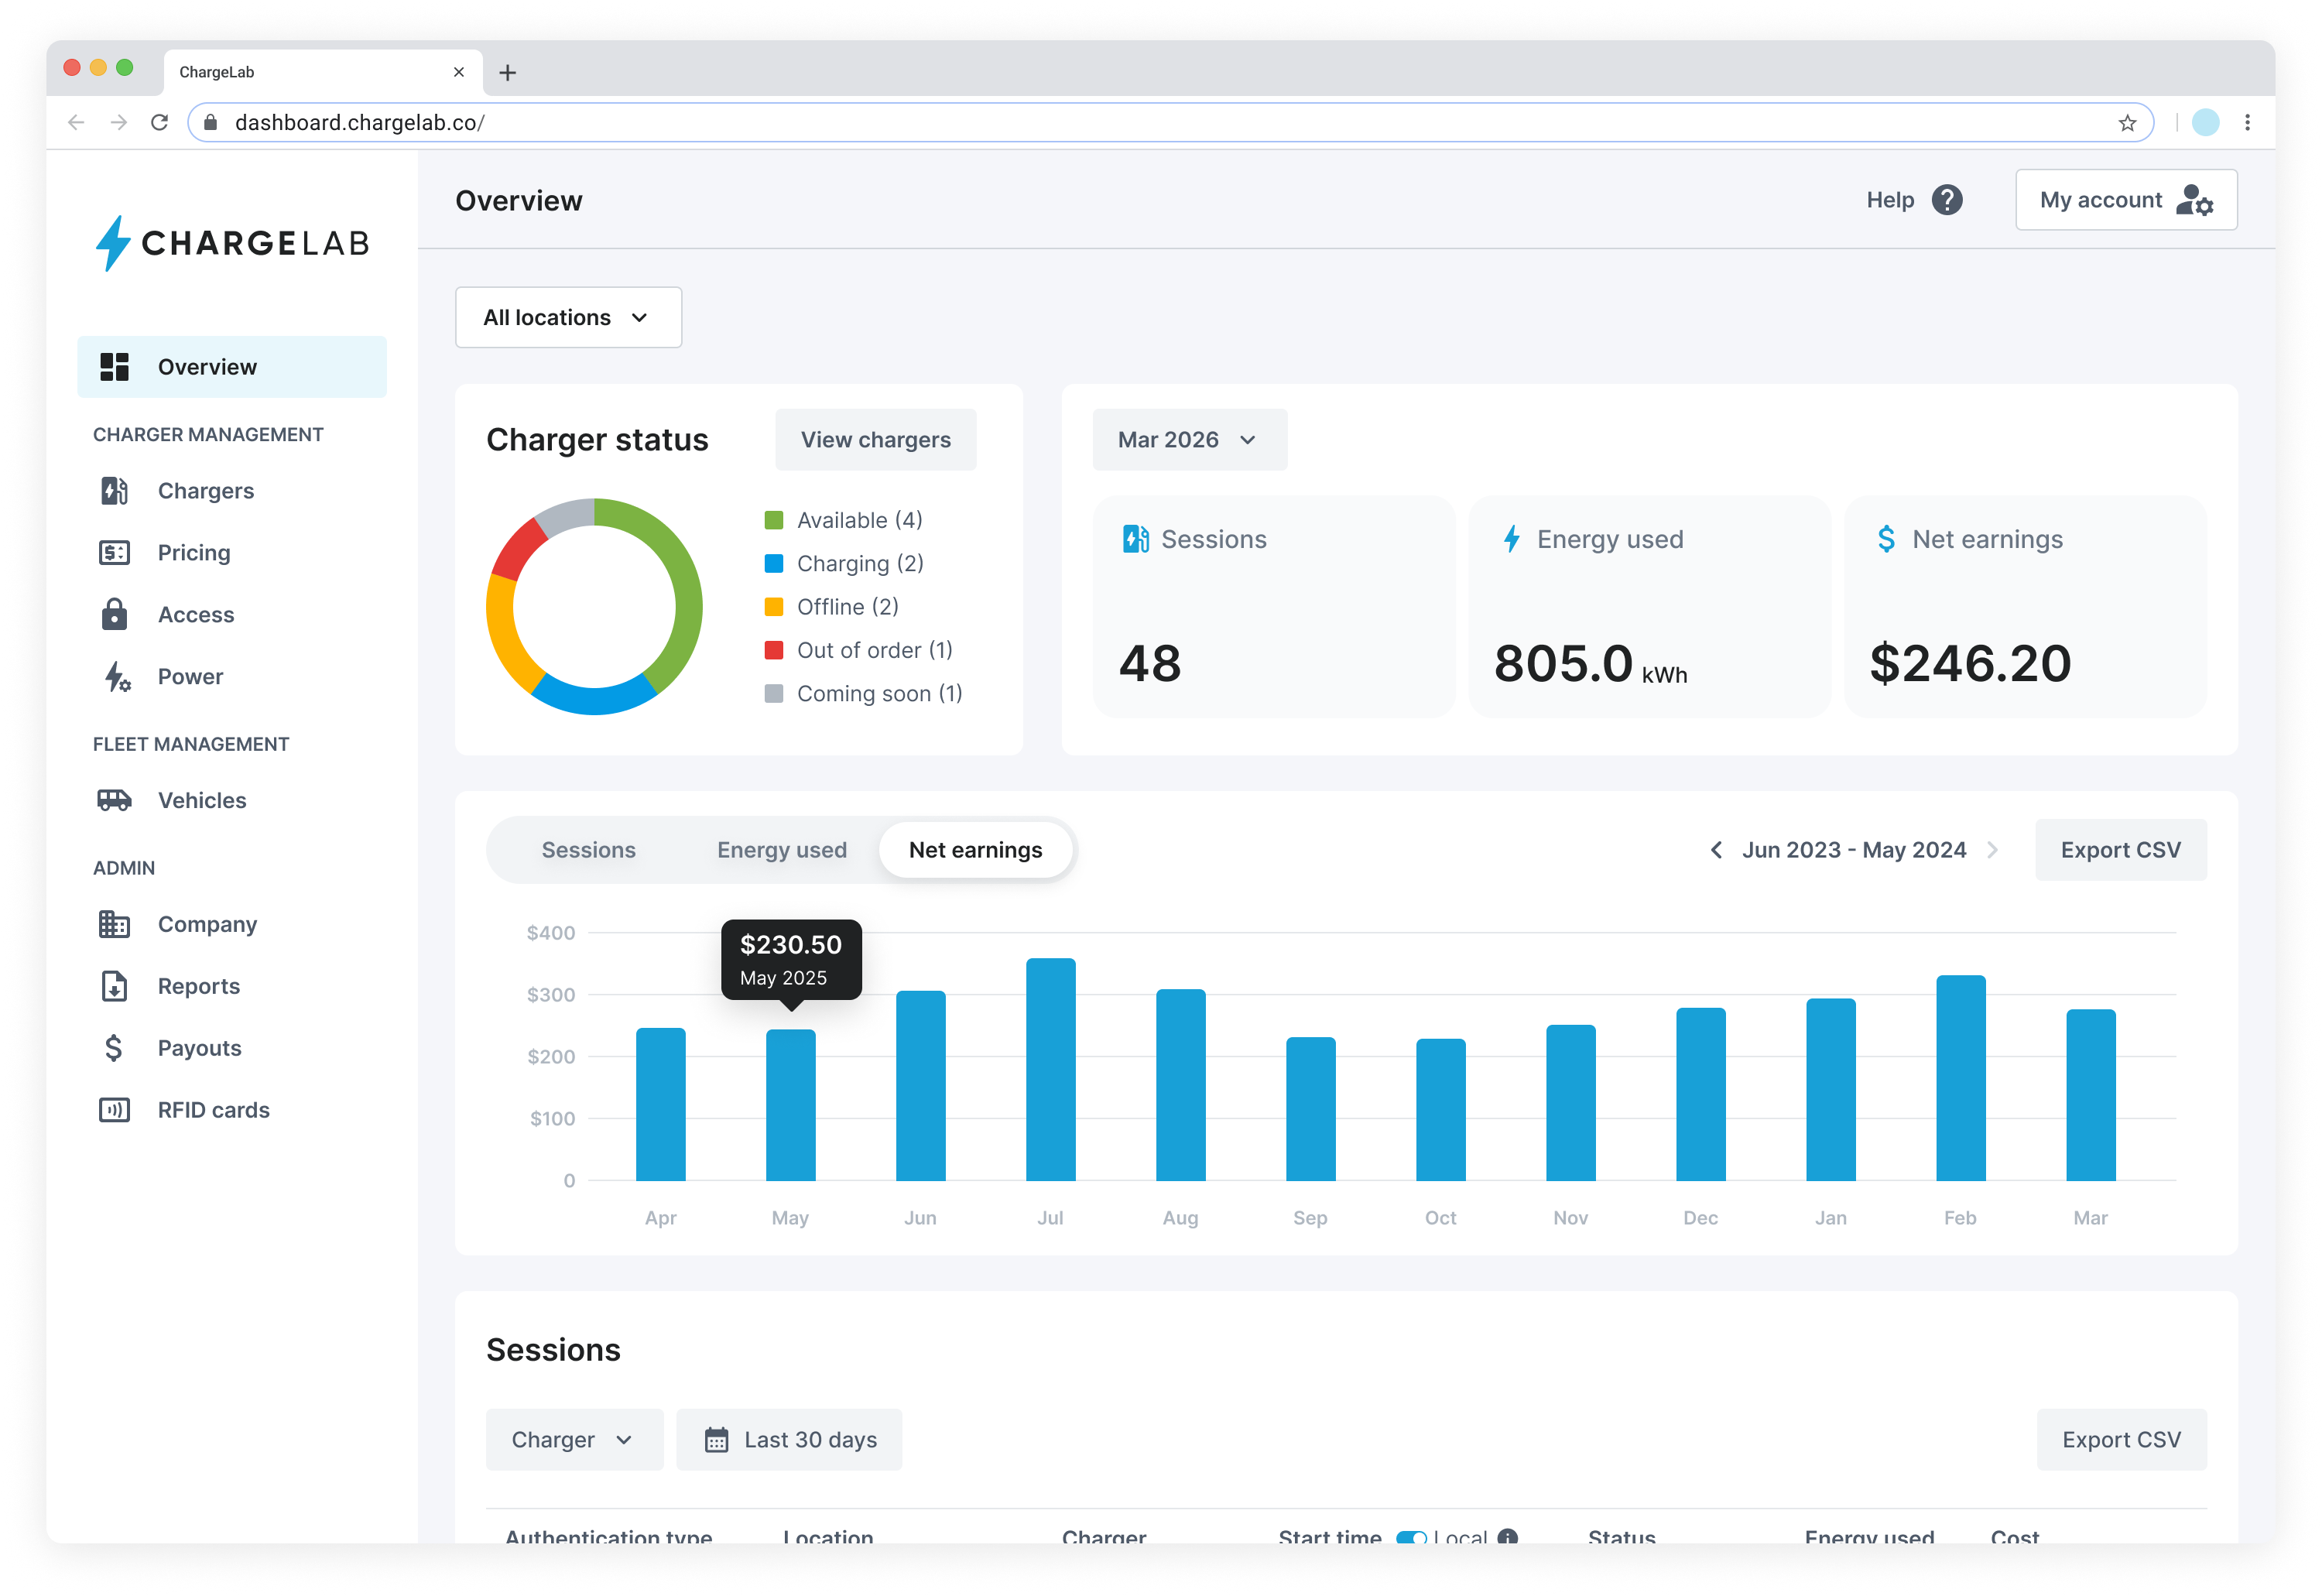
In order to address these issues, I executed on a full redesign and rebuild of the Dashboard.

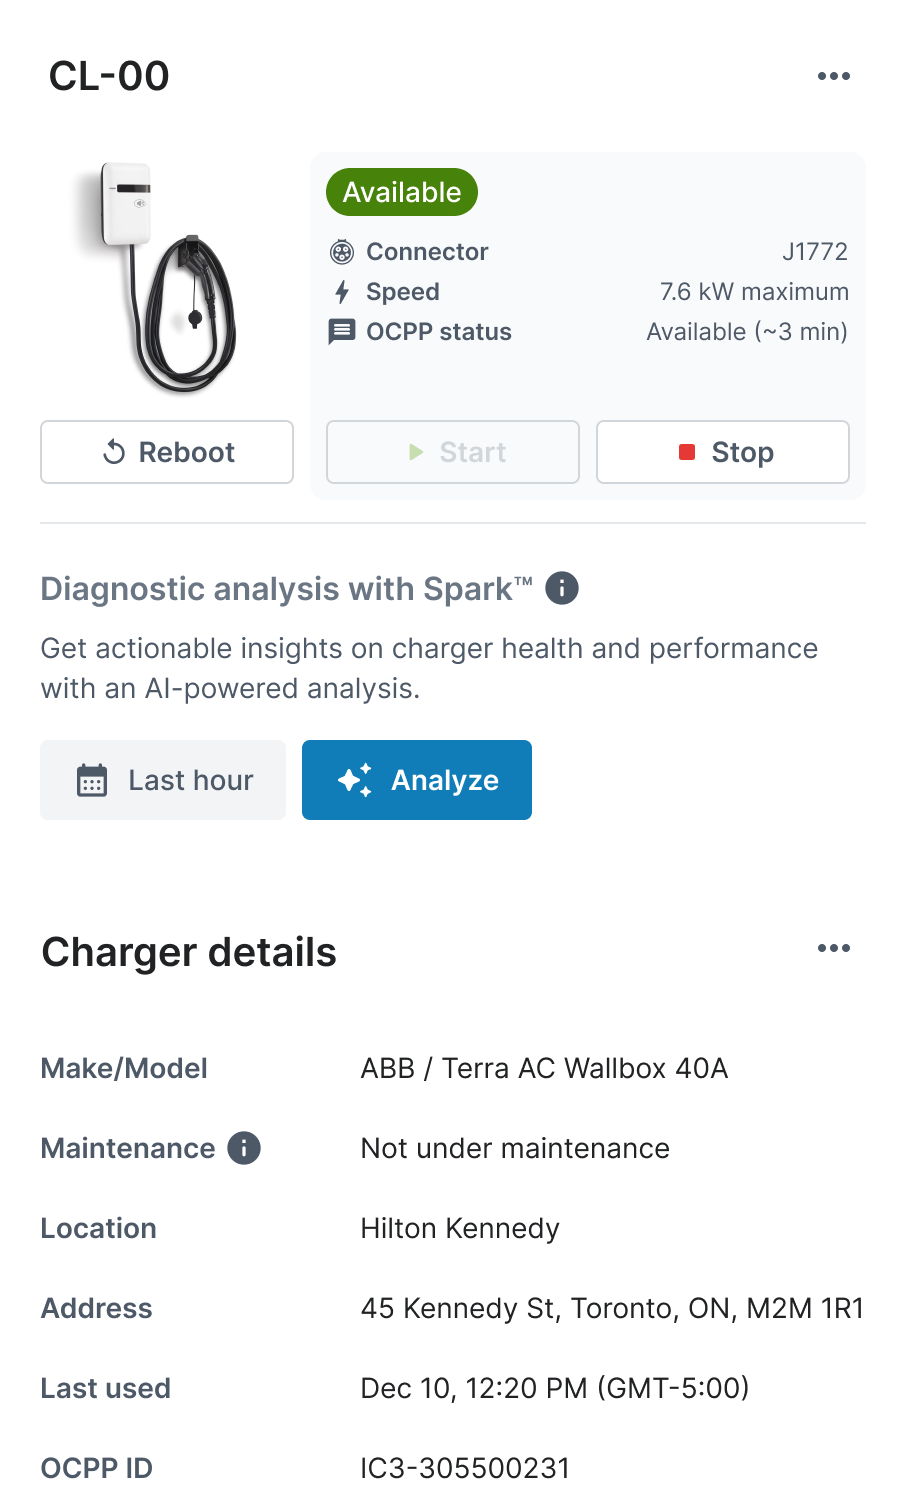
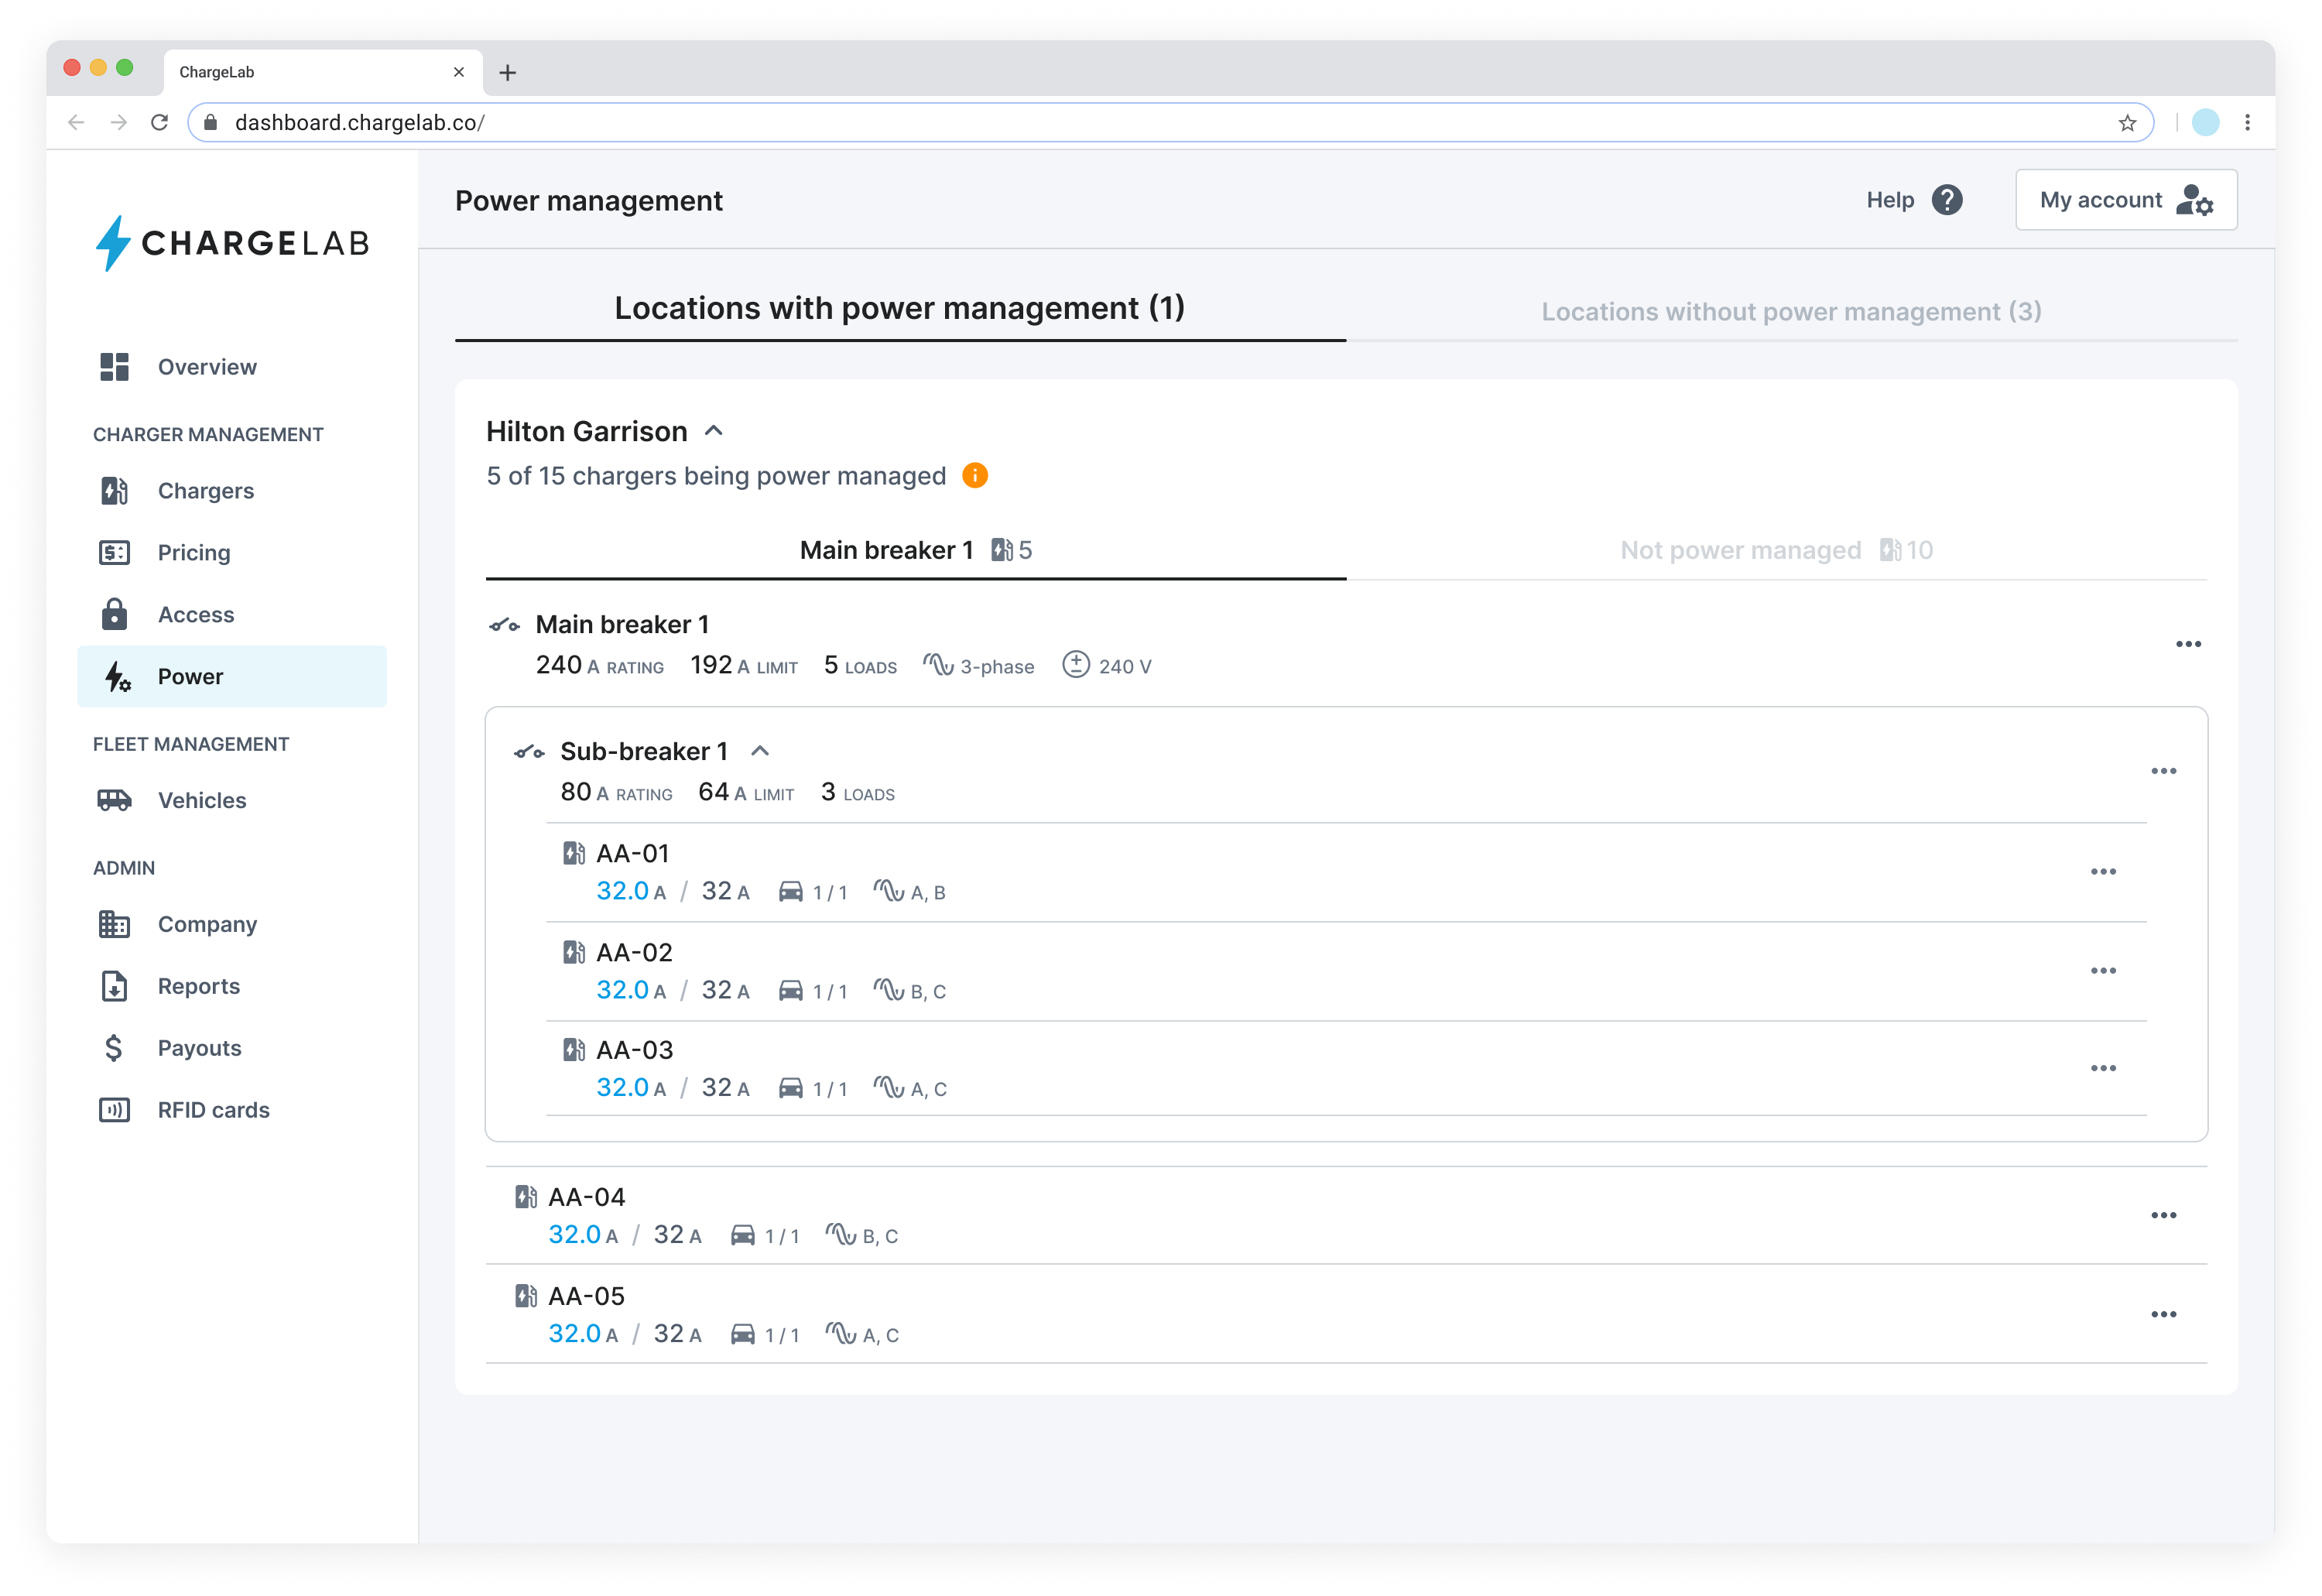
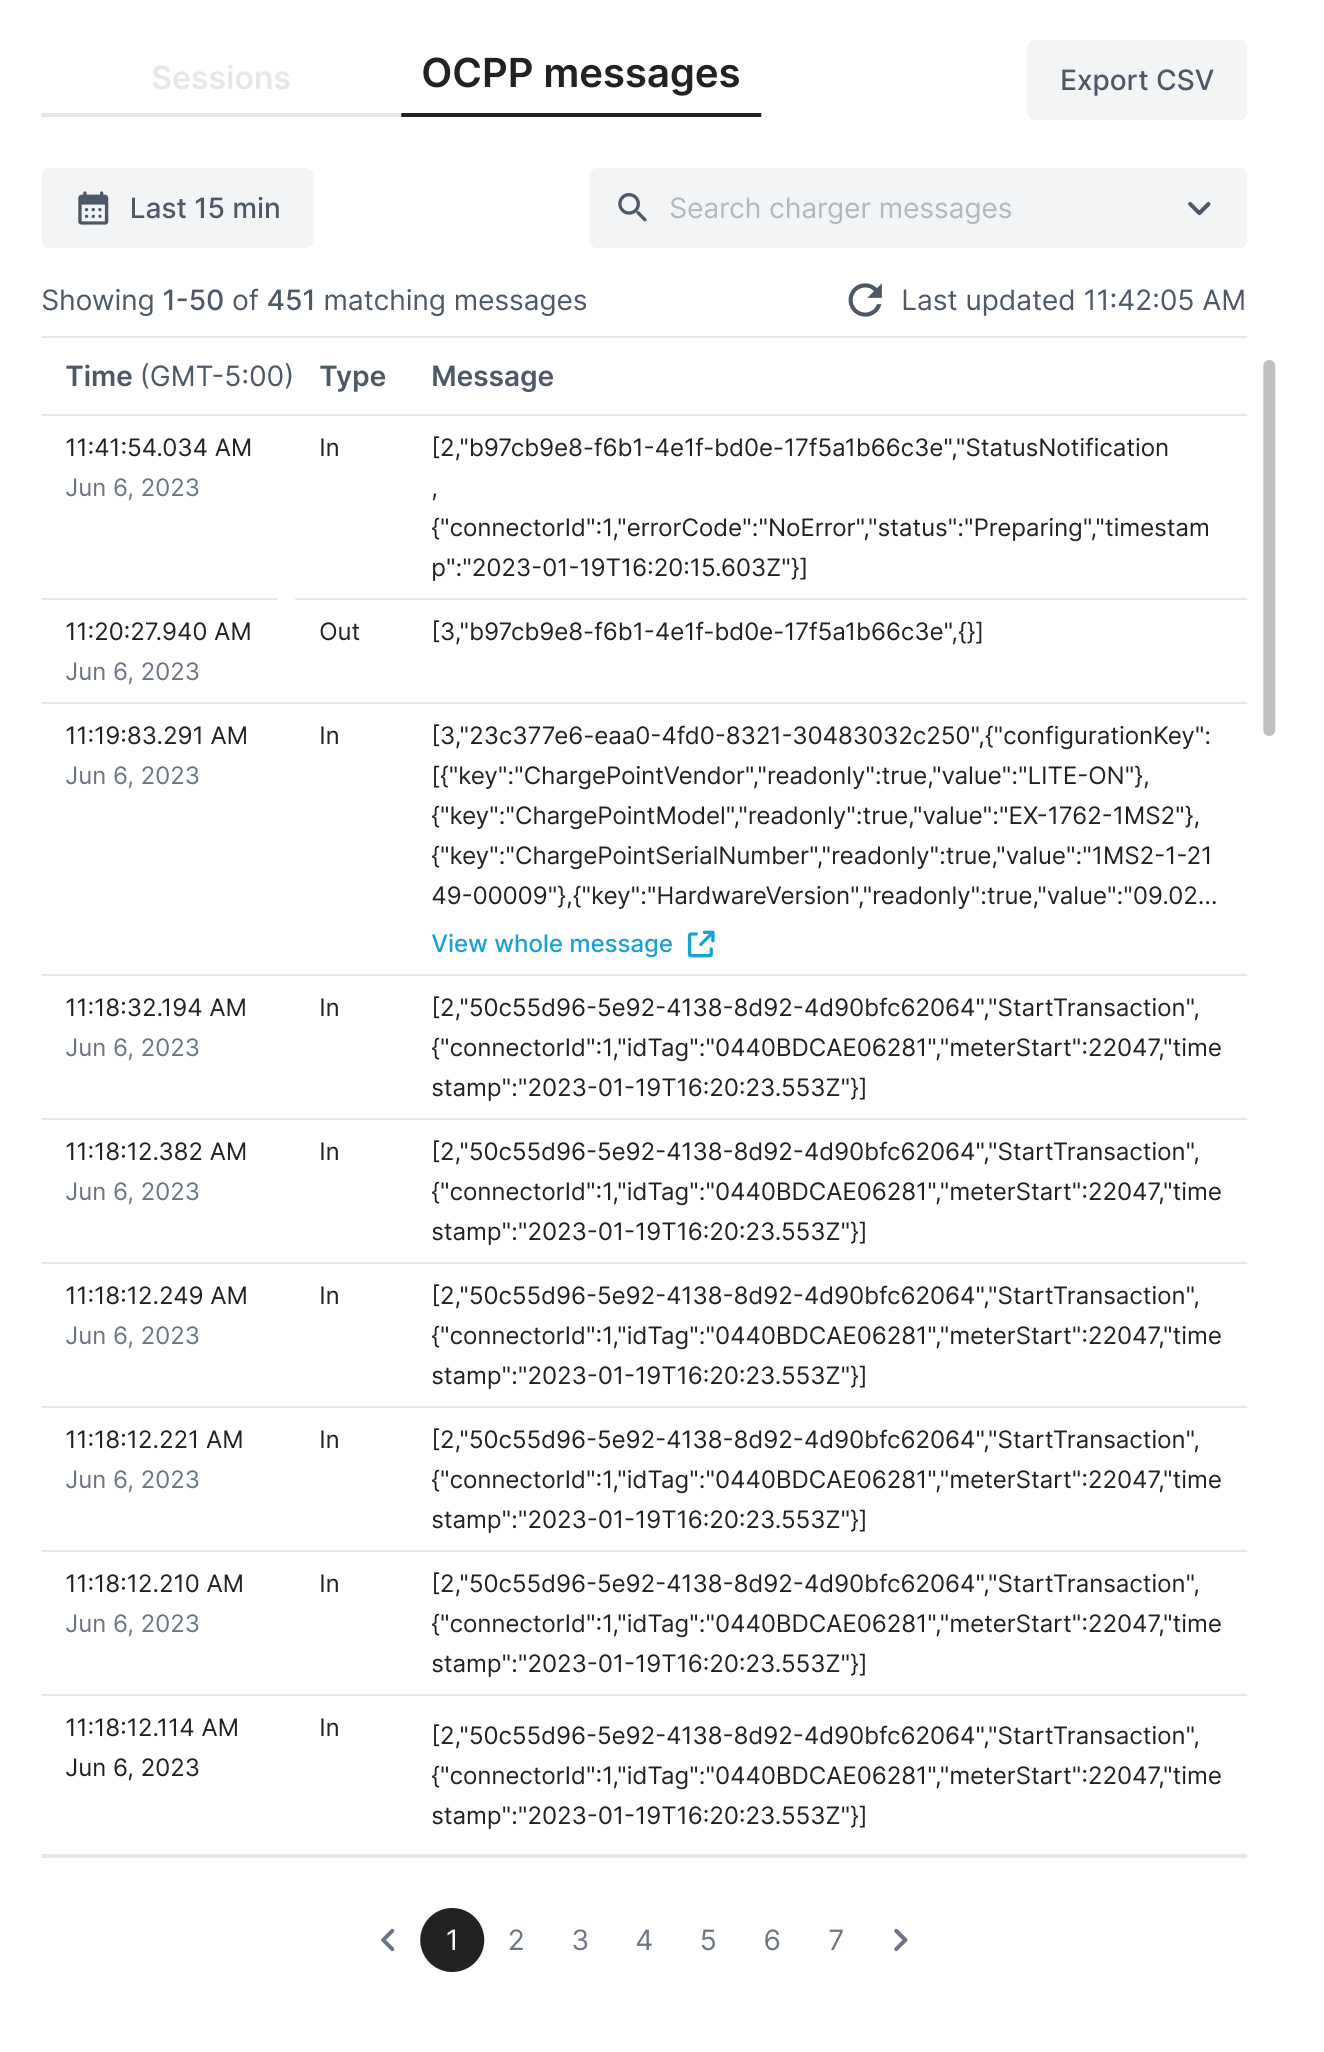
This has been a years-long effort, beginning with a relaunch of a new overarching design system and architecture, then continuing with new workflow and page designs for key user tasks, such as charger troubleshooting, power management, pricing controls, reporting, and more.

Additionally, I implemented a robust user research program on the Product team, ensuring that the team was able to connect with current and potential site hosts and better understand their core needs.

Metrics

As the EV charging industry has evolved, so too have ChargeLab and the Dashboard.


Key usage and experience metrics continue to climb alongside improvements to the product, and ChargeLab has established itself as a company punching above its weight in the user experience category.

April 2022

July 2025

Connected EV chargers

<1,000

Over 10,000

Site host NPS

N/A

(no measurement implemented)

16

(scale from -100 to 100)

Active user research council member clients

N/A

(no user research apparatus)

430

registered participants

Of course, these metrics are the result of the entire ChargeLab team’s hard work and dedication, but it wouldn’t have been possible without the design work that went into revitalizing and revamping our core product.

To timeline

© Tom Garncarz 2025

Tom Garncarz

Product Designer

Send me an email!

EV Charging Site Host Dashboard

ChargeLab

//

May 2022 - present

Product design

Information architecture

B2B

Desktop

User research

Climate

As ChargeLab’s sole product designer (and then as its Head of Design), one of my core responsibilities has been to redesign the company’s core products to give them a best-in-class user experience in the crowded electric vehicle (EV) charging market.

One of these products is the Site Host Dashboard, a B2B product aimed at helping owners of EV charging sites manage, maintain, and profit from their chargers.
Scroll

Key issues

When I joined ChargeLab in 2022, the Site Host Dashboard had three fundamental issues holding the company back from scaling:

1. Prospects didn’t want it

The existing iteration of the Dashboard was not very visually appealing and was stylistically years out of date. The Sales team didn’t feel comfortable showing it to prospective clients, limiting the company’s ability to meaningfully compete in the market.

2. Existing users weren’t happy

Furthermore, existing users of the Dashboard had to contend with a number of significant bugs and usability issues, causing friction and churn.

3. The team couldn’t build on it

Because the Dashboard’s information architecture was not designed to be scalable, adding new features and responding to evolving user needs was very difficult and time consuming for the Product and Engineering teams.

The initial iteration of the dashboard suffered from a number of significant design issues, and were a significant drag on ChargeLab’s performance.

Changes

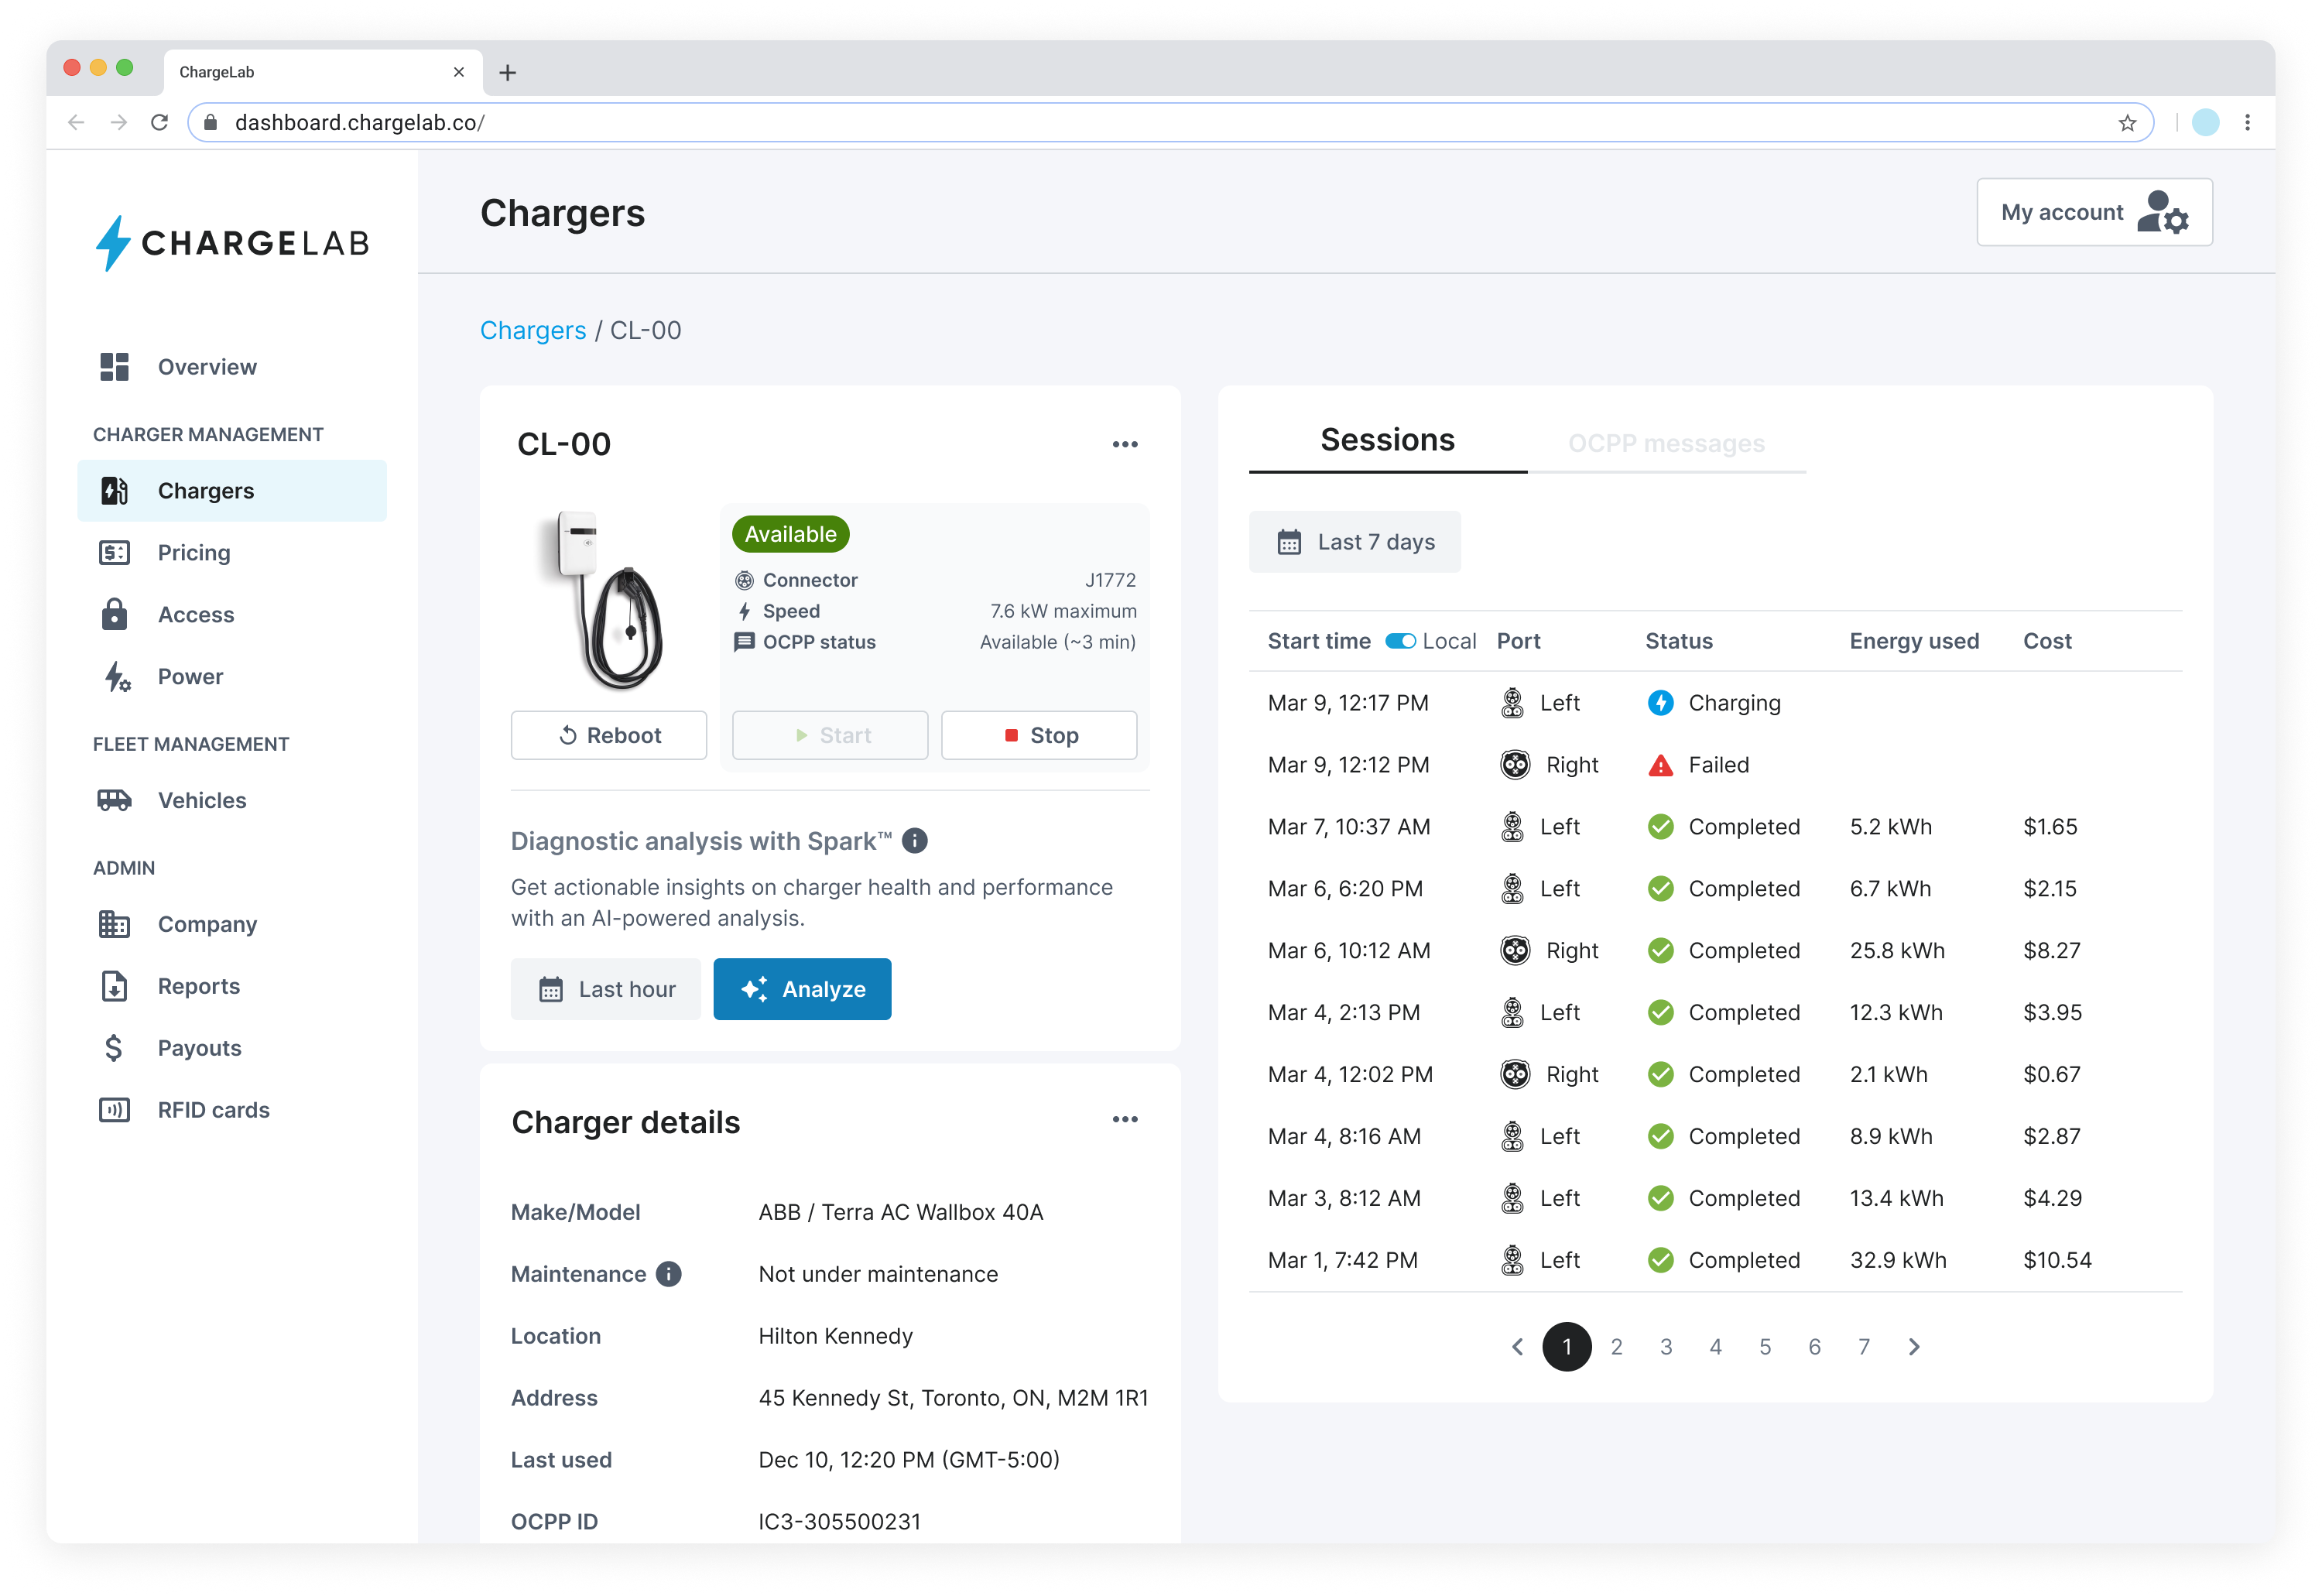
In order to address these issues, I executed on a full redesign and rebuild of the Dashboard.

This has been a years-long effort, beginning with a relaunch of a new overarching design system and architecture, then continuing with new workflow and page designs for key user tasks, such as charger troubleshooting, power management, pricing controls, reporting, and more.

Additionally, I implemented a robust user research program on the Product team, ensuring that the team was able to connect with current and potential site hosts and better understand their core needs.

Metrics

As the EV charging industry has evolved, so too have ChargeLab and the Dashboard.


Key usage and experience metrics continue to climb alongside improvements to the product, and ChargeLab has established itself as a company punching above its weight in the user experience category.

April 2022

July 2025

Connected EV chargers

<1,000

Over 10,000

Site host NPS

N/A

(no measurement implemented)

16

(scale from -100 to 100)

Active user research council member clients

N/A

(no formal user research apparatus)

430

registered participants

Of course, these metrics are the result of the entire ChargeLab team’s hard work and dedication, but it wouldn’t have been possible without the design work that went into revitalizing and revamping our core product.

Back to the timeline

© Tom Garncarz 2025

Tom Garncarz

Product Designer

Send me an email!

EV Charging Site Host Dashboard

ChargeLab

//

May 2022 - present

Product design

Information architecture

B2B

Desktop

User research

Climate

As ChargeLab’s sole product designer (and then as its Head of Design), one of my core responsibilities has been to redesign the company’s core products to give them a best-in-class user experience in the crowded electric vehicle (EV) charging market.

One of these products is the Site Host Dashboard, a B2B product aimed at helping owners of EV charging sites manage, maintain, and profit from their chargers.
Scroll
Key issues

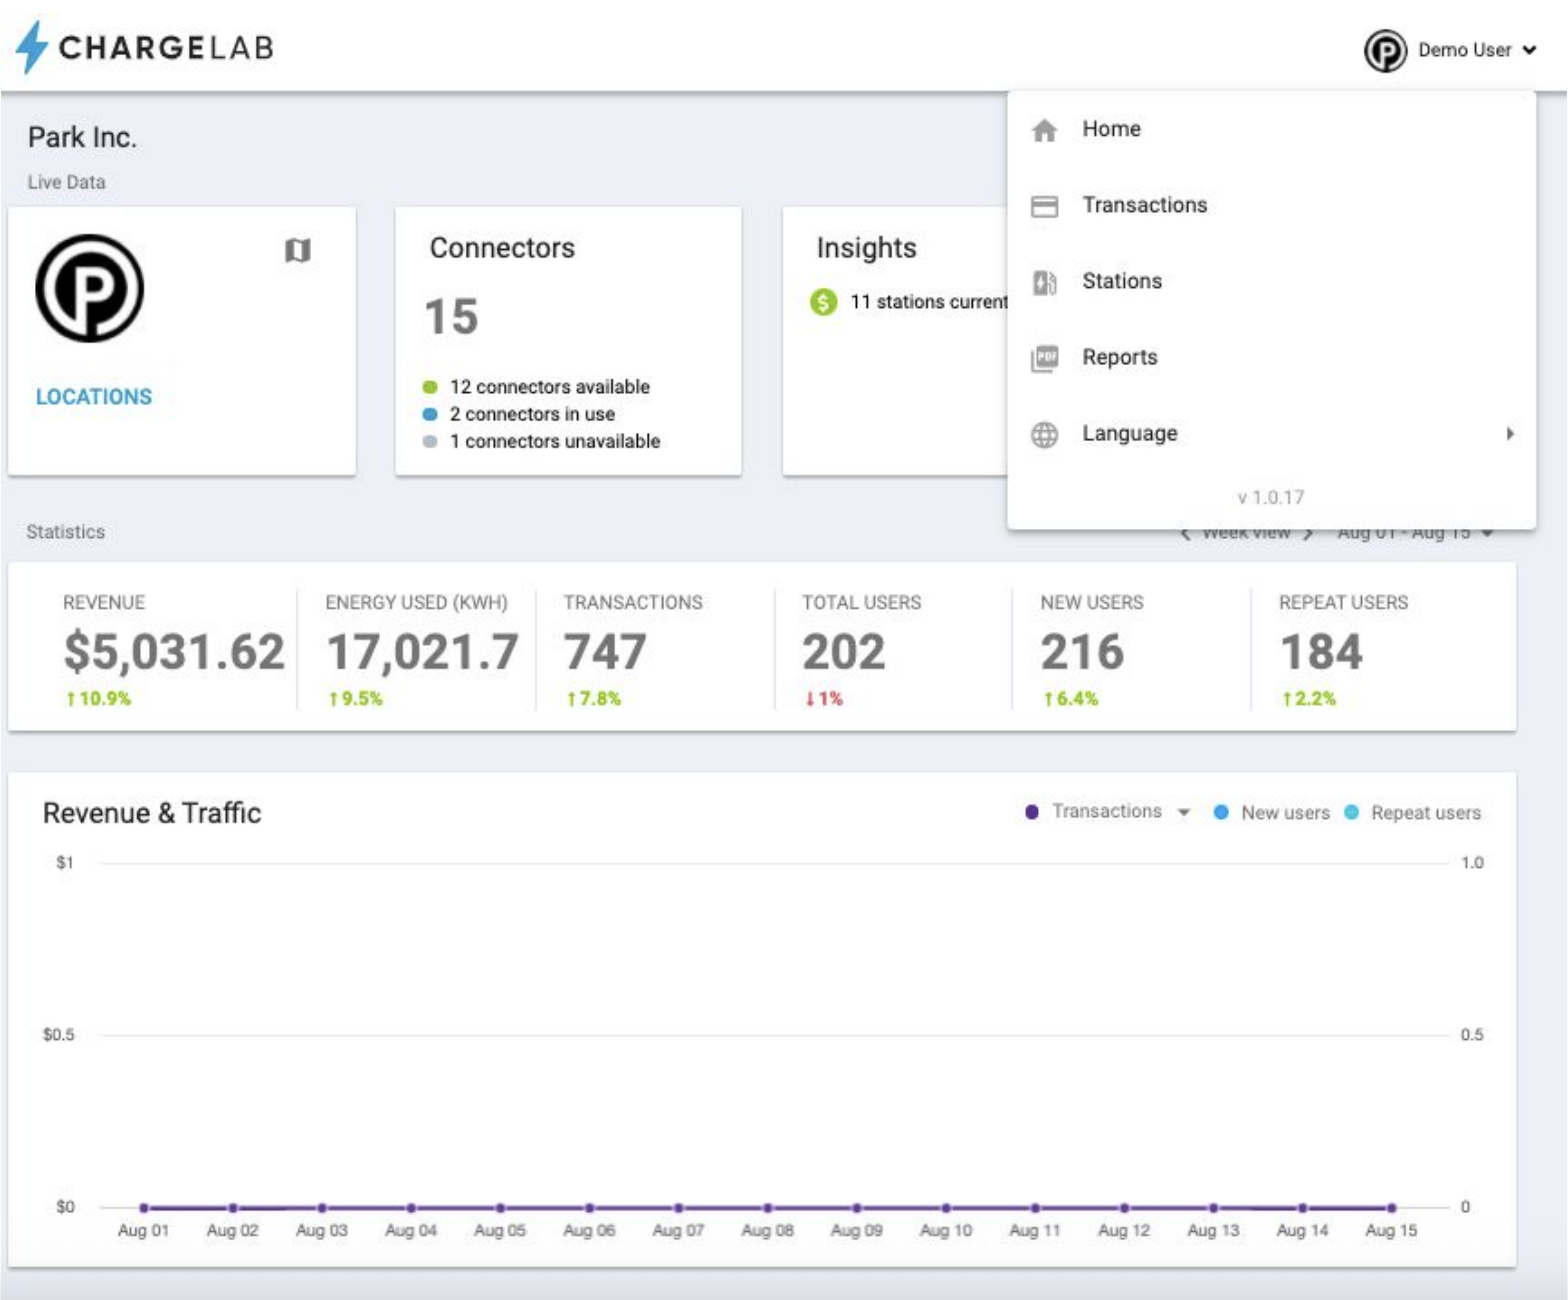
When I joined ChargeLab in 2022, the Site Host Dashboard had three fundamental issues holding the company back from scaling:

1. Prospects didn’t want it

The existing iteration of the Dashboard was not very visually appealing and was stylistically years out of date. The Sales team didn’t feel comfortable showing it to prospective clients, limiting the company’s ability to meaningfully compete in the market.

2. Existing users weren’t happy

Furthermore, existing users of the Dashboard had to contend with a number of significant bugs and usability issues, causing friction and churn.

3. The team couldn’t build on it

Because the Dashboard’s information architecture was not designed to be scalable, adding new features and responding to evolving user needs was very difficult and time consuming for the Product and Engineering teams.

The initial iteration of the dashboard suffered from a number of significant design issues, and were a significant drag on ChargeLab’s performance.
Changes

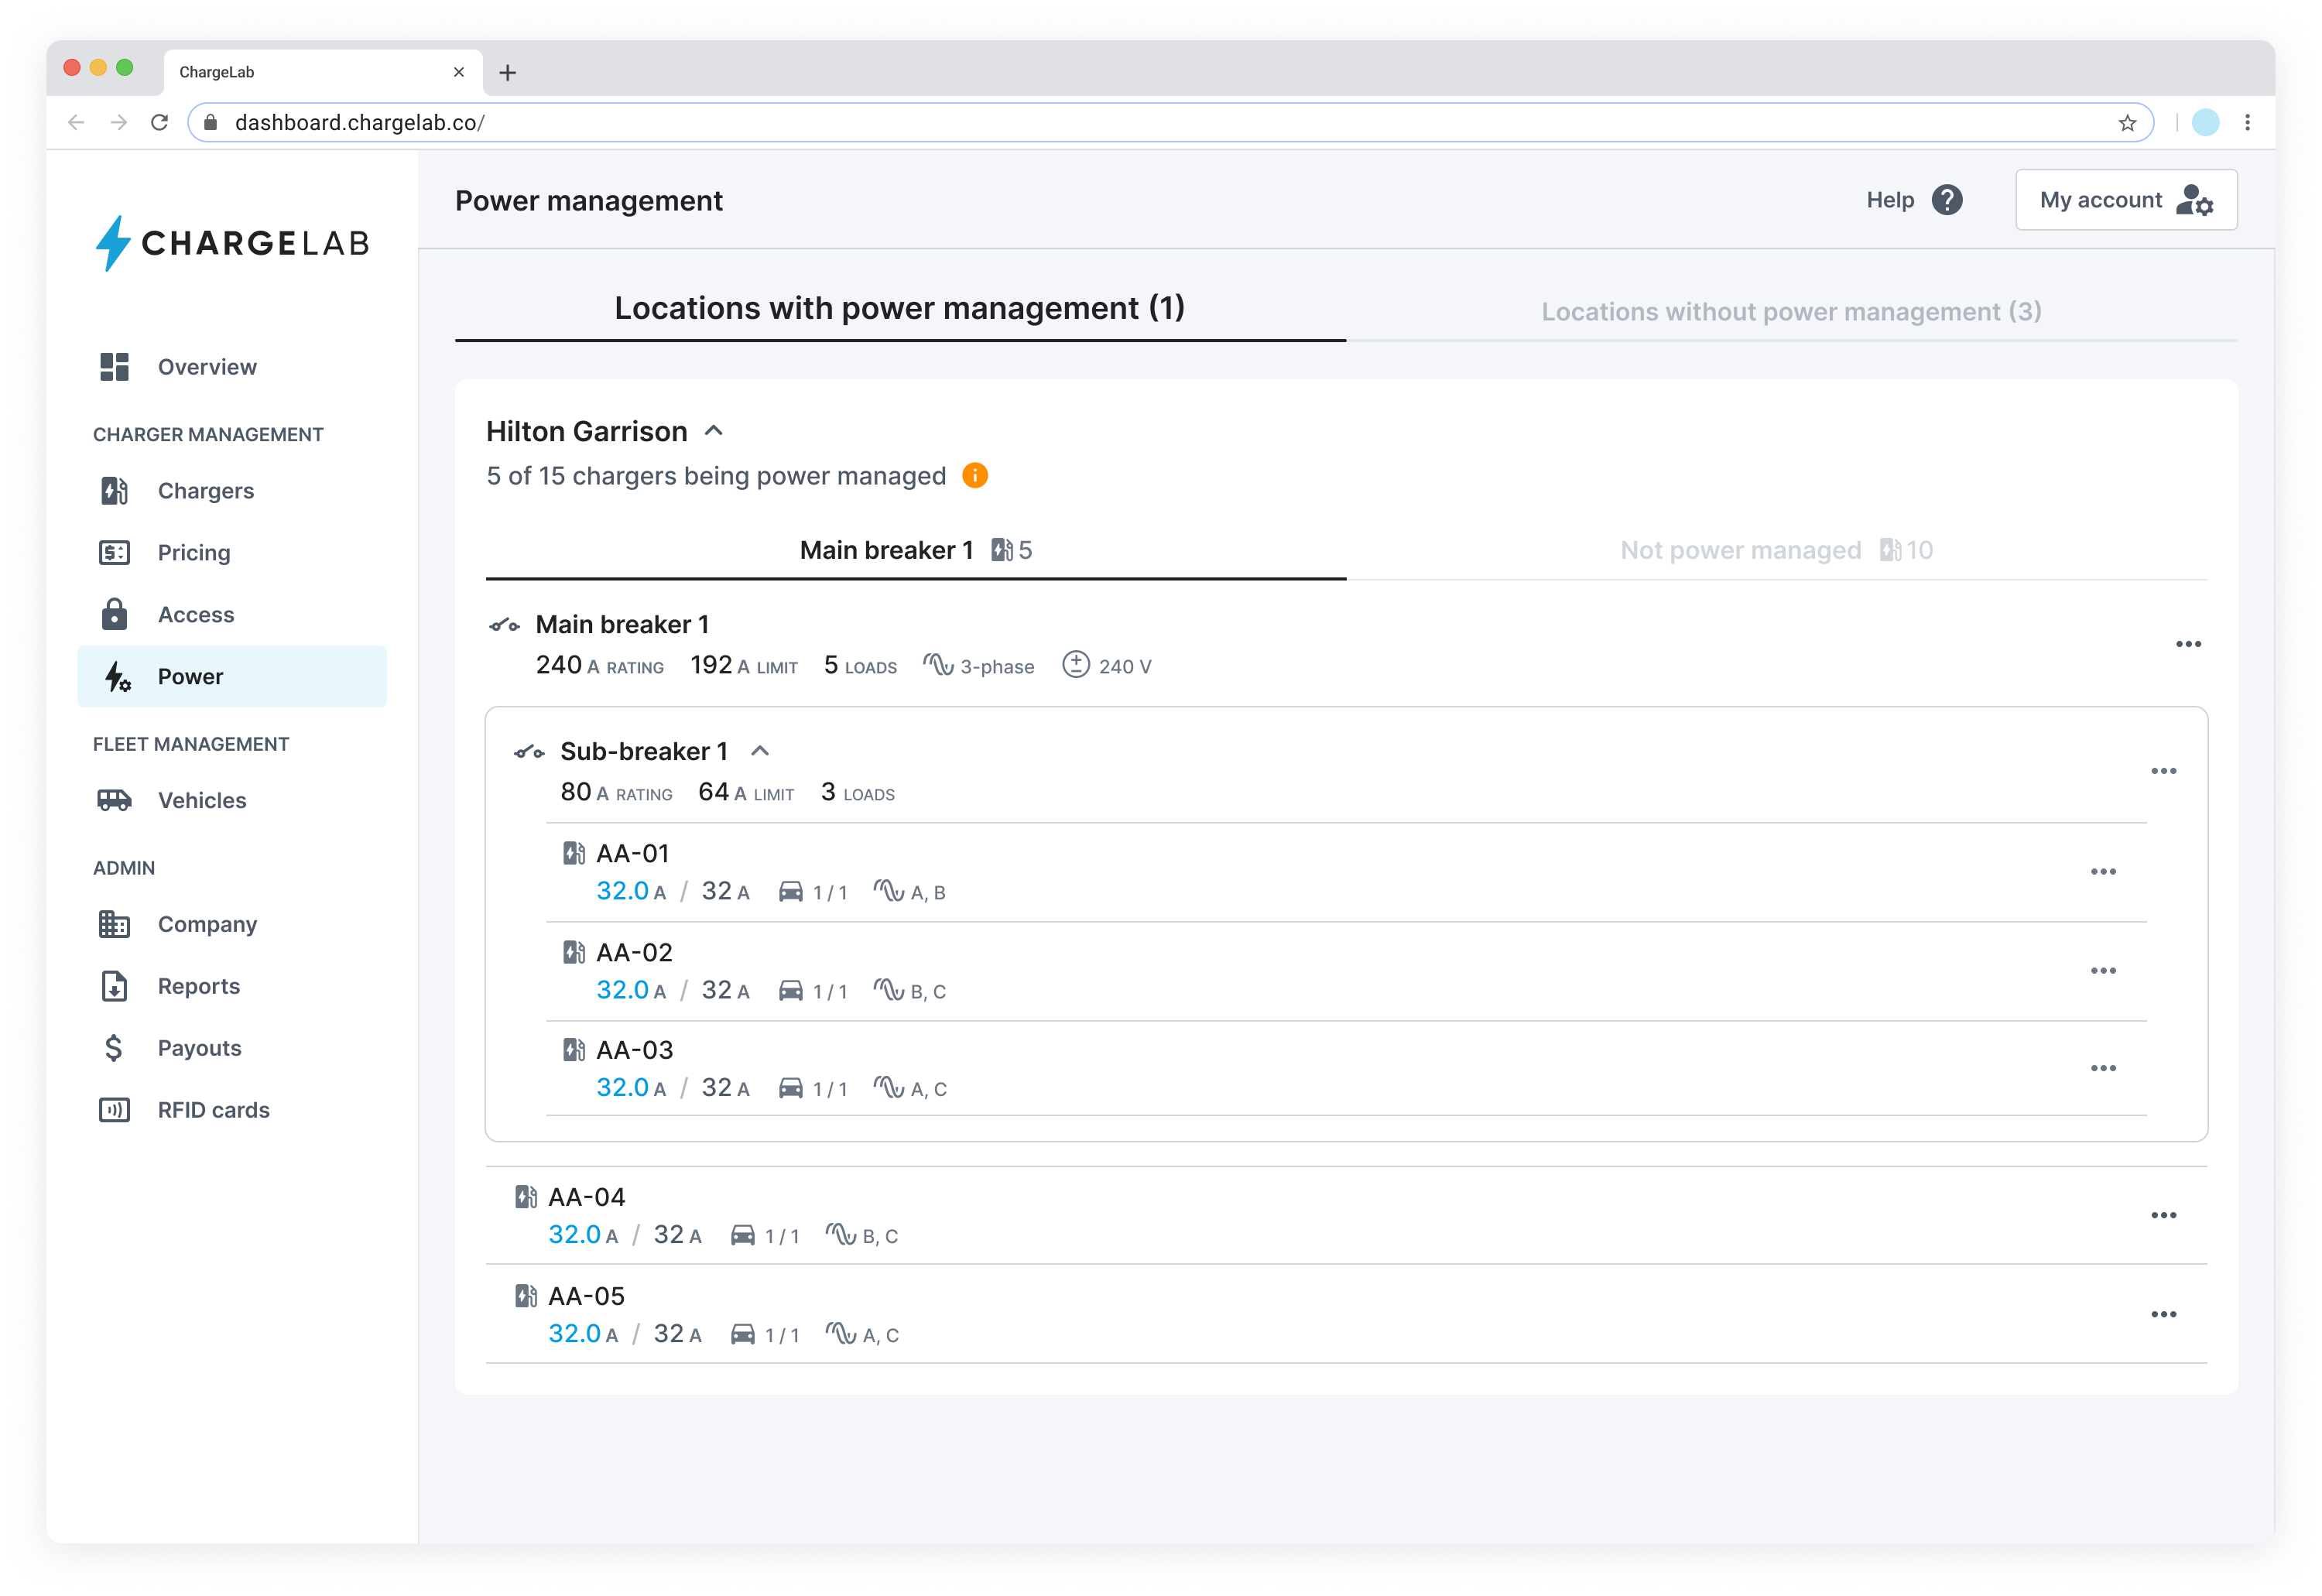
In order to address these issues, I executed on a full redesign and rebuild of the Dashboard.

This has been a years-long effort, beginning with a relaunch of a new overarching design system and architecture, then continuing with new workflow and page designs for key user tasks, such as charger troubleshooting, power management, pricing controls, reporting, and more.

Additionally, I implemented a robust user research program on the Product team, ensuring that the team was able to connect with current and potential site hosts and better understand their core needs.

Metrics

As the EV charging industry has evolved, so too have ChargeLab and the Dashboard. Key usage and experience metrics continue to climb alongside improvements to the product, and ChargeLab has established itself as a company punching above its weight in the user experience category.

April 2022

July 2025

Connected EV chargers

<1,000

Over 10,000

Site host NPS

N/A (no measurement implemented)

16 (scale from -100 to 100)

Active user research council member clients

N/A (no formal user research apparatus)

430 registered participants

Of course, these metrics are the result of the entire ChargeLab team’s hard work and dedication, but it wouldn’t have been possible without the design work that went into revitalizing and revamping our core product.